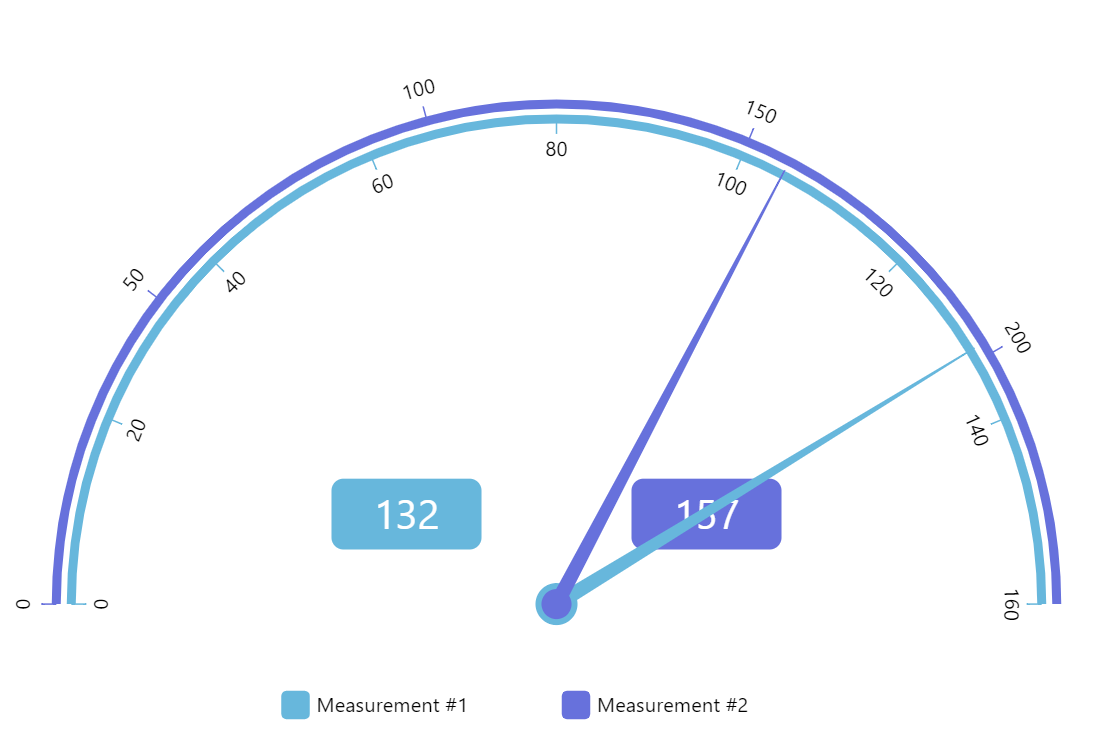
Angular Gauge with Two Axes
Like most amCharts charts you can have multiple axes in Gauge charts as well. This also enables multiple independent clock hands pointing to values on different scales.
Key implementation details
We create an inner axis with a negative radius on its renderer and inside set to true on it and its ticks template. Then we add a second axis the same way we would do in a single axis scenario.
Related tutorials
Demo source
<!-- Styles -->
<style>
#chartdiv {
  width: 100%;
  height: 500px;
}
</style>

<!-- Resources -->
<script src="https://cdn.amcharts.com/lib/5/index.js"></script>
<script src="https://cdn.amcharts.com/lib/5/xy.js"></script>
<script src="https://cdn.amcharts.com/lib/5/radar.js"></script>
<script src="https://cdn.amcharts.com/lib/5/themes/Animated.js"></script>

<!-- Chart code -->
<script>
am5.ready(function() {

// Create root element
// https://www.amcharts.com/docs/v5/getting-started/#Root_element
var root = am5.Root.new("chartdiv");


// Set themes
// https://www.amcharts.com/docs/v5/concepts/themes/
root.setThemes([
  am5themes_Animated.new(root)
]);


// Create chart
// https://www.amcharts.com/docs/v5/charts/radar-chart/
var chart = root.container.children.push(am5radar.RadarChart.new(root, {
  panX: false,
  panY: false,
  startAngle: 180,
  endAngle: 360,
  radius: am5.percent(90),
  layout: root.verticalLayout
}));


// Colors
var colors = am5.ColorSet.new(root, {
  step: 2
});


// Measurement #1

// Axis
var color1 = colors.next();

var axisRenderer1 = am5radar.AxisRendererCircular.new(root, {
  radius: -10,
  stroke: color1,
  strokeOpacity: 1,
  strokeWidth: 6,
  inside: true
});

axisRenderer1.grid.template.setAll({
  forceHidden: true
});

axisRenderer1.ticks.template.setAll({
  stroke: color1,
  visible: true,
  length: 10,
  strokeOpacity: 1,
  inside: true
});

axisRenderer1.labels.template.setAll({
  radius: 15,
  inside: true
});

var xAxis1 = chart.xAxes.push(am5xy.ValueAxis.new(root, {
  maxDeviation: 0,
  min: 0,
  max: 160,
  strictMinMax: true,
  renderer: axisRenderer1
}));


// Label
var label1 = chart.seriesContainer.children.push(am5.Label.new(root, {
  fill: am5.color(0xffffff),
  x: -100,
  y: -60,
  width: 100,
  centerX: am5.percent(50),
  textAlign: "center",
  centerY: am5.percent(50),
  fontSize: "2em",
  text: "0",
  background: am5.RoundedRectangle.new(root, {
    fill: color1
  })
}));

// Add clock hand
var axisDataItem1 = xAxis1.makeDataItem({
  value: 0,
  fill: color1,
  name: "Measurement #1"
});

var clockHand1 = am5radar.ClockHand.new(root, {
  pinRadius: 14,
  radius: am5.percent(98),
  bottomWidth: 10
});

clockHand1.pin.setAll({
  fill: color1
});

clockHand1.hand.setAll({
  fill: color1
});

var bullet1 = axisDataItem1.set("bullet", am5xy.AxisBullet.new(root, {
  sprite: clockHand1
}));

xAxis1.createAxisRange(axisDataItem1);

axisDataItem1.get("grid").set("forceHidden", true);
axisDataItem1.get("tick").set("forceHidden", true);


// Measurement #2

// Axis
var color2 = colors.next();

var axisRenderer2 = am5radar.AxisRendererCircular.new(root, {
  //innerRadius: -40,
  stroke: color2,
  strokeOpacity: 1,
  strokeWidth: 6
});

axisRenderer2.grid.template.setAll({
  forceHidden: true
});

axisRenderer2.ticks.template.setAll({
  stroke: color2,
  visible: true,
  length: 10,
  strokeOpacity: 1
});

axisRenderer2.labels.template.setAll({
  radius: 15
});

var xAxis2 = chart.xAxes.push(am5xy.ValueAxis.new(root, {
  maxDeviation: 0,
  min: 0,
  max: 240,
  strictMinMax: true,
  renderer: axisRenderer2
}));


// Label
var label2 = chart.seriesContainer.children.push(am5.Label.new(root, {
  fill: am5.color(0xffffff),
  x: 100,
  y: -60,
  width: 100,
  centerX: am5.percent(50),
  textAlign: "center",
  centerY: am5.percent(50),
  fontSize: "2em",
  text: "0",
  background: am5.RoundedRectangle.new(root, {
    fill: color2
  })
}));


// Add clock hand
var axisDataItem2 = xAxis2.makeDataItem({
  value: 0,
  fill: color2,
  name: "Measurement #2"
});

var clockHand2 = am5radar.ClockHand.new(root, {
  pinRadius: 10,
  radius: am5.percent(98),
  bottomWidth: 10
});

clockHand2.pin.setAll({
  fill: color2
});

clockHand2.hand.setAll({
  fill: color2
});

var bullet2 = axisDataItem2.set("bullet", am5xy.AxisBullet.new(root, {
  sprite: clockHand2
}));

xAxis2.createAxisRange(axisDataItem2);

axisDataItem2.get("grid").set("forceHidden", true);
axisDataItem2.get("tick").set("forceHidden", true);


// Legend
var legend = chart.children.push(am5.Legend.new(root, {
  x: am5.p50,
  centerX: am5.p50
}));
legend.data.setAll([axisDataItem1, axisDataItem2])


// Animate values
setInterval(function () {
  var value1 = Math.round(Math.random() * 160);
  axisDataItem1.animate({
    key: "value",
    to: value1,
    duration: 1000,
    easing: am5.ease.out(am5.ease.cubic)
  });

  label1.set("text", value1);

  var value2 = Math.round(Math.random() * 240);
  axisDataItem2.animate({
    key: "value",
    to: value2,
    duration: 1000,
    easing: am5.ease.out(am5.ease.cubic)
  });

  label2.set("text", value2);
}, 2000)

// chart.bulletsContainer.set("mask", undefined);


// // Create axis ranges bands
// // https://www.amcharts.com/docs/v5/charts/radar-chart/gauge-charts/#Bands
// var bandsData = [{
//   title: "Unsustainable",
//   color: "#ee1f25",
//   lowScore: -40,
//   highScore: -20
// }, {
//   title: "Volatile",
//   color: "#f04922",
//   lowScore: -20,
//   highScore: 0
// }, {
//   title: "Foundational",
//   color: "#fdae19",
//   lowScore: 0,
//   highScore: 20
// }, {
//   title: "Developing",
//   color: "#f3eb0c",
//   lowScore: 20,
//   highScore: 40
// }, {
//   title: "Maturing",
//   color: "#b0d136",
//   lowScore: 40,
//   highScore: 60
// }, {
//   title: "Sustainable",
//   color: "#54b947",
//   lowScore: 60,
//   highScore: 80
// }, {
//   title: "High Performing",
//   color: "#0f9747",
//   lowScore: 80,
//   highScore: 100
// }];

// am5.array.each(bandsData, function (data) {
//   var axisRange = xAxis.createAxisRange(xAxis.makeDataItem({}));

//   axisRange.setAll({
//     value: data.lowScore,
//     endValue: data.highScore
//   });

//   axisRange.get("axisFill").setAll({
//     visible: true,
//     fill: am5.color(data.color),
//     fillOpacity: 0.8
//   });

//   axisRange.get("label").setAll({
//     text: data.title,
//     inside: true,
//     radius: 15,
//     fontSize: "0.9em",
//     fill: root.interfaceColors.get("background")
//   });
// });


// Make stuff animate on load
chart.appear(1000, 100);

}); // end am5.ready()
</script>

<!-- HTML -->
<div id="chartdiv"></div>