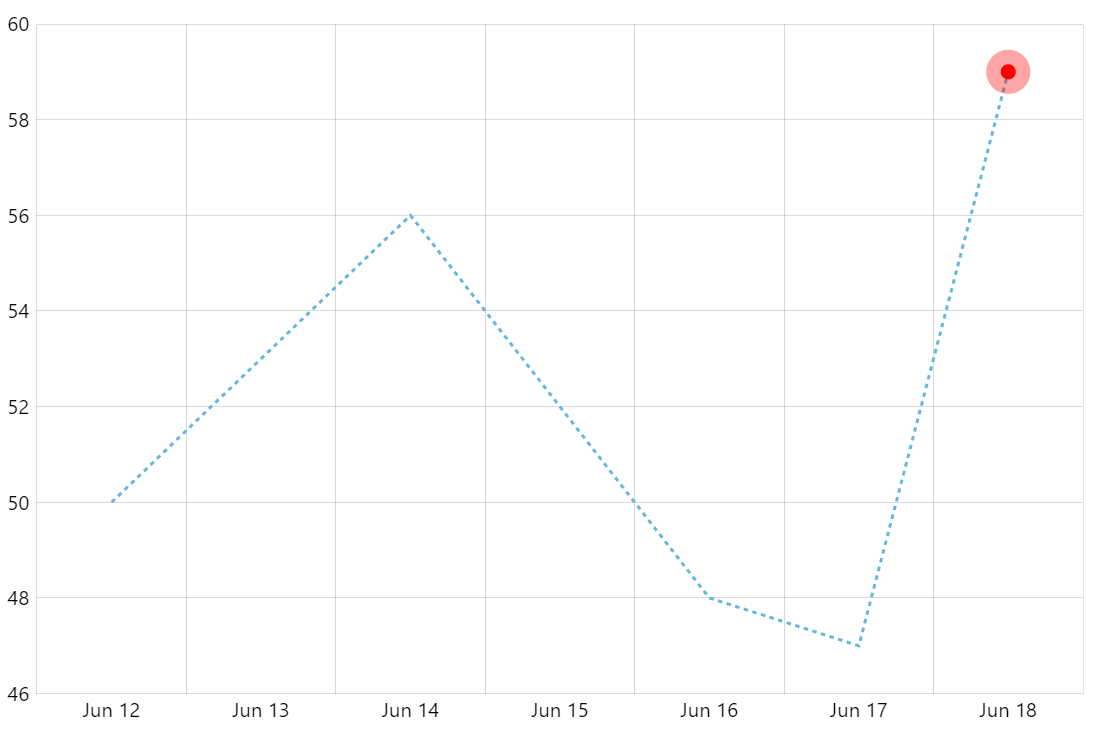
Animated Bullet at the End of the Series
Displaying a pulsating element at a data point on a chart is a great way to attract viewer’s attention. This demo shows you how to do it with amCharts.
Key implementation details
To achieve this effect we create a bullet comprising of two circles. Then we animate both radius and opacity on one of them using built-in animation tools. And that’s it.
Related tutorials
Demo source
<!-- Styles -->
<style>
#chartdiv {
  width: 100%;
  height: 500px;
}
</style>

<!-- Resources -->
<script src="https://cdn.amcharts.com/lib/5/index.js"></script>
<script src="https://cdn.amcharts.com/lib/5/xy.js"></script>
<script src="https://cdn.amcharts.com/lib/5/themes/Animated.js"></script>

<!-- Chart code -->
<script>
am5.ready(function() {

// Create root element
// https://www.amcharts.com/docs/v5/getting-started/#Root_element
var root = am5.Root.new("chartdiv");


// Set themes
// https://www.amcharts.com/docs/v5/concepts/themes/
root.setThemes([
  am5themes_Animated.new(root)
]);


// Create chart
// https://www.amcharts.com/docs/v5/charts/xy-chart/
var chart = root.container.children.push(am5xy.XYChart.new(root, {
  panX: true,
  panY: true,
  wheelX: "panX",
  wheelY: "zoomX",
  pinchZoomX:true,
  paddingLeft: 0
}));

chart.get("colors").set("step", 3);


// Add cursor
// https://www.amcharts.com/docs/v5/charts/xy-chart/cursor/
var cursor = chart.set("cursor", am5xy.XYCursor.new(root, {}));
cursor.lineY.set("visible", false);


// Create axes
// https://www.amcharts.com/docs/v5/charts/xy-chart/axes/
var xAxis = chart.xAxes.push(am5xy.DateAxis.new(root, {
  maxDeviation: 0.3,
  baseInterval: {
    timeUnit: "day",
    count: 1
  },
  renderer: am5xy.AxisRendererX.new(root, {
    minorGridEnabled: true,
    minGridDistance: 70
  }),
  tooltip: am5.Tooltip.new(root, {})
}));

var yAxis = chart.yAxes.push(am5xy.ValueAxis.new(root, {
  maxDeviation: 0.3,
  renderer: am5xy.AxisRendererY.new(root, {})
}));


// Create series
// https://www.amcharts.com/docs/v5/charts/xy-chart/series/
var series = chart.series.push(am5xy.LineSeries.new(root, {
  name: "Series 1",
  xAxis: xAxis,
  yAxis: yAxis,
  valueYField: "value",
  valueXField: "date",
  tooltip: am5.Tooltip.new(root, {
    labelText: "{valueY}"
  })
}));
series.strokes.template.setAll({
  strokeWidth: 2,
  strokeDasharray: [3, 3]
});

// Create animating bullet by adding two circles in a bullet container and
// animating radius and opacity of one of them.
series.bullets.push(function(root, series, dataItem) {
  if (dataItem.dataContext.bullet) {
    var container = am5.Container.new(root, {});
    var circle0 = container.children.push(am5.Circle.new(root, {
      radius: 5,
      fill: am5.color(0xff0000)
    }));
    var circle1 = container.children.push(am5.Circle.new(root, {
      radius: 5,
      fill: am5.color(0xff0000)
    }));

    circle1.animate({
      key: "radius",
      to: 20,
      duration: 1000,
      easing: am5.ease.out(am5.ease.cubic),
      loops: Infinity
    });
    circle1.animate({
      key: "opacity",
      to: 0,
      from: 1,
      duration: 1000,
      easing: am5.ease.out(am5.ease.cubic),
      loops: Infinity
    });

    return am5.Bullet.new(root, {
      sprite: container
    })
  }
})

// Set data
var data = [{
  date: new Date(2021, 5, 12).getTime(),
  value: 50
}, {
  date: new Date(2021, 5, 13).getTime(),
  value: 53
}, {
  date: new Date(2021, 5, 14).getTime(),
  value: 56
}, {
  date: new Date(2021, 5, 15).getTime(),
  value: 52
}, {
  date: new Date(2021, 5, 16).getTime(),
  value: 48
}, {
  date: new Date(2021, 5, 17).getTime(),
  value: 47
}, {
  date: new Date(2021, 5, 18).getTime(),
  value: 59,
  bullet: true
}]

series.data.setAll(data);


// Make stuff animate on load
// https://www.amcharts.com/docs/v5/concepts/animations/
series.appear(1000);
chart.appear(1000, 100);

}); // end am5.ready()
</script>

<!-- HTML -->
<div id="chartdiv"></div>