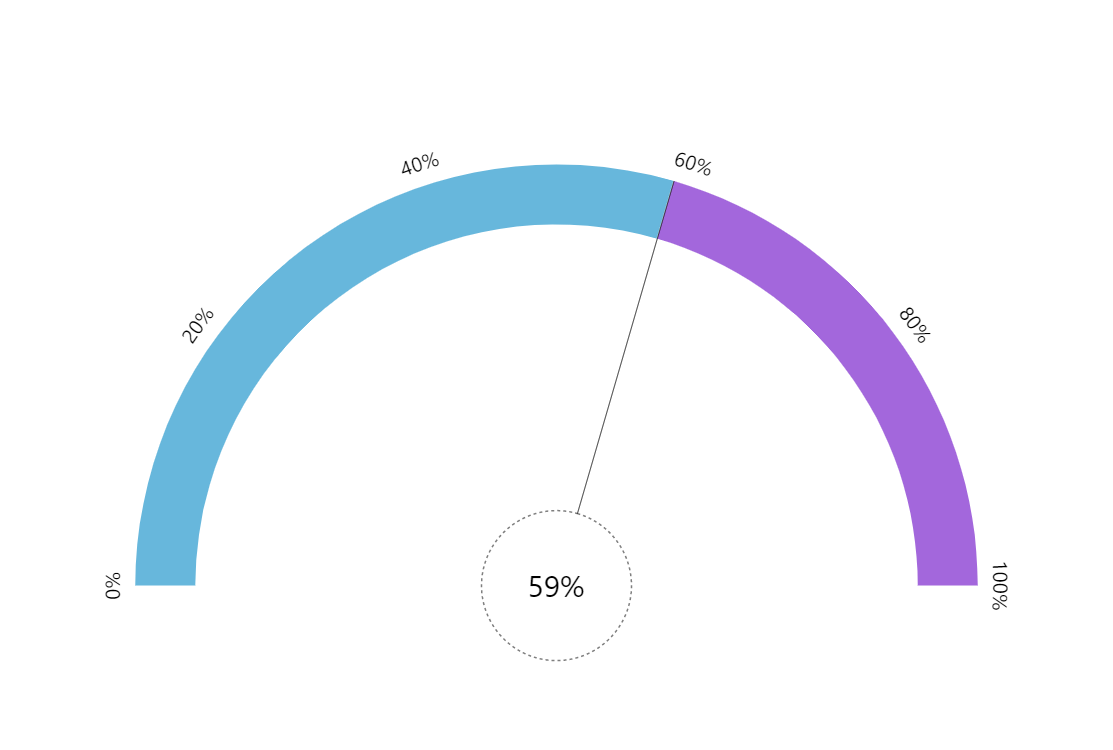
Animated Gauge
Gauge charts are most useful for displaying live data. This demo shows such a chart in action.
Key implementation details
The colored bands on the circular axis are created using the axis range feature. The “clock hand” is configured to have a large “pin” in the center and a thin “hand”. Then we just animate all of these in unison when data changes.
Related tutorials
Demo source
<!-- Styles -->
<style>
#chartdiv {
  width: 100%;
  height: 500px;
}
</style>

<!-- Resources -->
<script src="https://cdn.amcharts.com/lib/5/index.js"></script>
<script src="https://cdn.amcharts.com/lib/5/xy.js"></script>
<script src="https://cdn.amcharts.com/lib/5/radar.js"></script>
<script src="https://cdn.amcharts.com/lib/5/themes/Animated.js"></script>

<!-- Chart code -->
<script>
am5.ready(function() {

// Create root element
// https://www.amcharts.com/docs/v5/getting-started/#Root_element
var root = am5.Root.new("chartdiv");

// Set themes
// https://www.amcharts.com/docs/v5/concepts/themes/
root.setThemes([
  am5themes_Animated.new(root)
]);

// Create chart
// https://www.amcharts.com/docs/v5/charts/radar-chart/
var chart = root.container.children.push(
  am5radar.RadarChart.new(root, {
    panX: false,
    panY: false,
    startAngle: 180,
    endAngle: 360
  })
);

chart.getNumberFormatter().set("numberFormat", "#'%'");

// Create axis and its renderer
// https://www.amcharts.com/docs/v5/charts/radar-chart/gauge-charts/#Axes
var axisRenderer = am5radar.AxisRendererCircular.new(root, {
  innerRadius: -40
});

axisRenderer.grid.template.setAll({
  stroke: root.interfaceColors.get("background"),
  visible: true,
  strokeOpacity: 0.8
});

var xAxis = chart.xAxes.push(
  am5xy.ValueAxis.new(root, {
    maxDeviation: 0,
    min: 0,
    max: 100,
    strictMinMax: true,
    renderer: axisRenderer
  })
);

// Add clock hand
// https://www.amcharts.com/docs/v5/charts/radar-chart/gauge-charts/#Clock_hands
var axisDataItem = xAxis.makeDataItem({});

var clockHand = am5radar.ClockHand.new(root, {
  pinRadius: 50,
  radius: am5.percent(100),
  innerRadius: 50,
  bottomWidth: 0,
  topWidth: 0
});

clockHand.pin.setAll({
  fillOpacity: 0,
  strokeOpacity: 0.5,
  stroke: am5.color(0x000000),
  strokeWidth: 1,
  strokeDasharray: [2, 2]
});
clockHand.hand.setAll({
  fillOpacity: 0,
  strokeOpacity: 0.5,
  stroke: am5.color(0x000000),
  strokeWidth: 0.5
});

var bullet = axisDataItem.set(
  "bullet",
  am5xy.AxisBullet.new(root, {
    sprite: clockHand
  })
);

xAxis.createAxisRange(axisDataItem);

var label = chart.radarContainer.children.push(
  am5.Label.new(root, {
    centerX: am5.percent(50),
    textAlign: "center",
    centerY: am5.percent(50),
    fontSize: "1.5em"
  })
);

axisDataItem.set("value", 50);
bullet.get("sprite").on("rotation", function () {
  var value = axisDataItem.get("value");
  label.set("text", Math.round(value).toString() + "%");
});

setInterval(function () {
  var value = Math.round(Math.random() * 100);

  axisDataItem.animate({
    key: "value",
    to: value,
    duration: 500,
    easing: am5.ease.out(am5.ease.cubic)
  });

  axisRange0.animate({
    key: "endValue",
    to: value,
    duration: 500,
    easing: am5.ease.out(am5.ease.cubic)
  });

  axisRange1.animate({
    key: "value",
    to: value,
    duration: 500,
    easing: am5.ease.out(am5.ease.cubic)
  });
}, 2000);

chart.bulletsContainer.set("mask", undefined);

var colorSet = am5.ColorSet.new(root, {});

var axisRange0 = xAxis.createAxisRange(
  xAxis.makeDataItem({
    above: true,
    value: 0,
    endValue: 50
  })
);

axisRange0.get("axisFill").setAll({
  visible: true,
  fill: colorSet.getIndex(0)
});

axisRange0.get("label").setAll({
  forceHidden: true
});

var axisRange1 = xAxis.createAxisRange(
  xAxis.makeDataItem({
    above: true,
    value: 50,
    endValue: 100
  })
);

axisRange1.get("axisFill").setAll({
  visible: true,
  fill: colorSet.getIndex(4)
});

axisRange1.get("label").setAll({
  forceHidden: true
});

// Make stuff animate on load
chart.appear(1000, 100);

}); // end am5.ready()
</script>

<!-- HTML -->
<div id="chartdiv"></div>