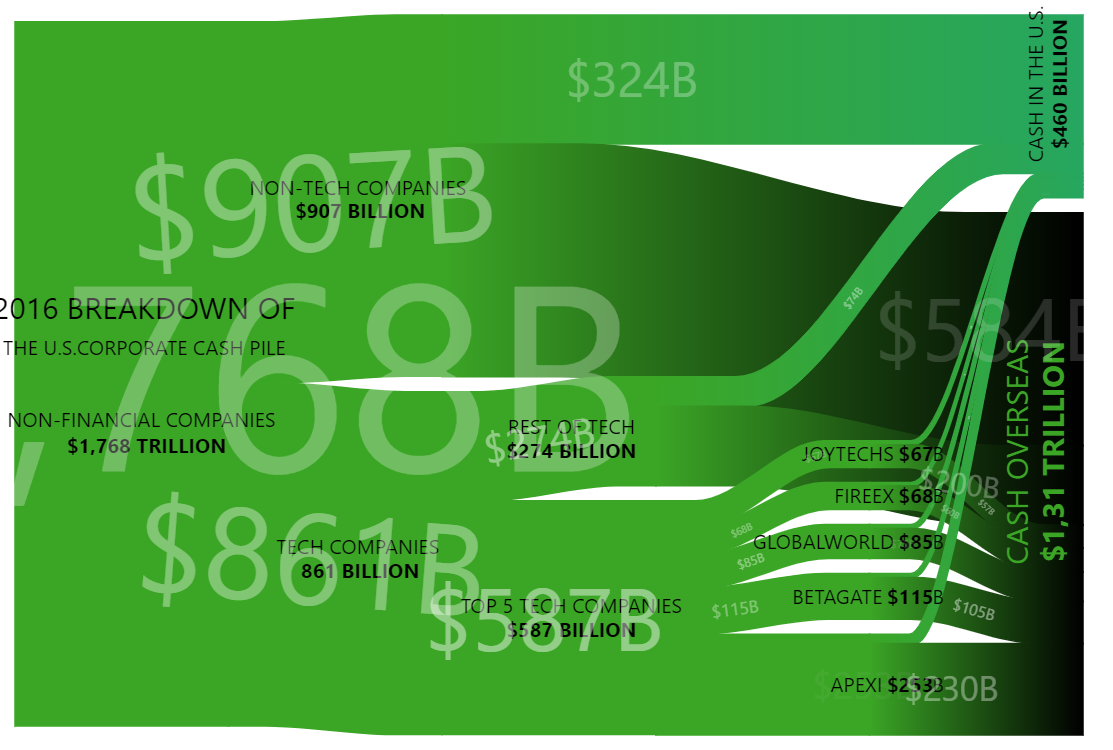
Animated Sankey Diagram
Besides being visually stunning, animations in data visualizations can help direct viewer’s attention and communicate the key information.
Key implementation details
To achieve the effect in this demo we use labels in bullets on the series items. Bullets have a locationX property and we animate it from 0 to 1 (start to finish of the item). We also adjust the opacity while animating to create a fade-in-fade-out effect.
Related tutorials
Demo source
<!-- Styles -->
<style>
#chartdiv {
  width: 100%;
  height: 600px;
}
</style>

<!-- Resources -->
<script src="https://cdn.amcharts.com/lib/5/index.js"></script>
<script src="https://cdn.amcharts.com/lib/5/flow.js"></script>
<script src="https://cdn.amcharts.com/lib/5/themes/Animated.js"></script>

<!-- Chart code -->
<script>
am5.ready(function() {

// Create root element
// https://www.amcharts.com/docs/v5/getting-started/#Root_element
var root = am5.Root.new("chartdiv");

// Set themes
// https://www.amcharts.com/docs/v5/concepts/themes/
root.setThemes([
  am5themes_Animated.new(root)
]);

// Create series
// https://www.amcharts.com/docs/v5/charts/flow-charts/
var series = root.container.children.push(
  am5flow.Sankey.new(root, {
    orientation: "horizontal",
    sourceIdField: "from",
    targetIdField: "to",
    valueField: "value"
  })
);

series.nodes.nodes.template.setAll({
  toggleKey:"none",
  cursorOverStyle:"default"
})

series.nodes.rectangles.template.setAll({
  fillOpacity: 0,
  strokeOpacity: 0
});

series.links.template.setAll({
  tooltipText: null,
  templateField: "linkSettings",
  fillOpacity: 1,
  strokeOpacity: 1,
  interactive: true
});
series.links.template.states.create("hover", {
  fillOpacity: 1
});
series.nodes.labels.template.setAll({
  forceHidden: true,
  templateField: "labelSettings"
});

series.nodes.data.setAll([
  { id: "Source", fill: am5.color(0x3ba626) },
  { id: "Total non financial companies", fill: am5.color(0x3ba626) },
  { id: "Non-tech companies", fill: am5.color(0x3ba626) },
  { id: "Tech companies", fill: am5.color(0x3ba626) },
  {
    id: "Cash in the U.S.",
    fill: am5.color(0x26a660),
    labelSettings: {
      rotation: -90,
      textAlign: "center",
      text: "CASH IN THE U.S.\n[bold]$460 BILLION",
      forceHidden: false,
      centerY: am5.p100
    }
  },
  {
    id: "Cash Overseas",
    fill: am5.color(0x000000),
    labelSettings: {
      rotation: -90,
      textAlign: "center",
      text:
        "[#3ba626 fontSize:1.5em]CASH OVERSEAS\n[bold #3ba626 fontSize:1.5em]$1,31 TRILLION",
      fill: am5.color(0xffffff),
      forceHidden: false,
      centerY: am5.p100
    }
  },
  { id: "Rest of tech", fill: am5.color(0x3ba626) },
  { id: "Top 5 tech companies", fill: am5.color(0x3ba626) },
  { id: "Joytechs", fill: am5.color(0x3ba626) },
  { id: "Fireex", fill: am5.color(0x3ba626) },
  { id: "Globalworld", fill: am5.color(0x3ba626) },
  { id: "Betagate", fill: am5.color(0x3ba626) },
  { id: "Apexi", fill: am5.color(0x3ba626) }
]);

series.bullets.push(function () {
  return am5.Bullet.new(root, {
    locationX: 0.5,
    sprite: am5.Label.new(root, {
      templateField: "labelSettings",
      textAlign: "center",
      centerY: am5.p50,
      paddingTop: 0,
      paddingBottom: 0
    })
  });
});

series.bullets.push(function () {
  return am5.Bullet.new(root, {
    locationX: 1,
    sprite: am5.Label.new(root, {
      templateField: "labelSettings2",
      centerY: am5.p50,
      paddingTop: 0,
      paddingBottom: 0
    })
  });
});

series.bullets.push(function (root, series, dataItem) {
  var label = am5.Label.new(root, {
    text: "${value}B",
    populateText: true,
    centerX: am5.p50,
    fill: am5.color(0xffffff),
    opacity: 0.2,
    fontSize: dataItem.get("value") / 10
  });
  var bullet = am5.Bullet.new(root, {
    locationX: 0,
    sprite: label,
    autoRotate: true
  });

  label.adapters.add("opacity", function (opacity) {
    return 0.5 - Math.abs(0.5 - bullet.get("locationX"));
  });

  bullet.animate({
    key: "locationX",
    from: 0,
    to: 1,
    duration: Math.random() * 10000 + 2000,
    loops: Infinity
  });
  bullet.on("locationX", function () {
    label.set("opacity", label.get("opacity"));
  });

  return bullet;
});

// Set data
// https://www.amcharts.com/docs/v5/charts/flow-charts/#Setting_data
series.data.setAll([
  {
    from: "Source",
    to: "Total non financial companies",
    value: 1768,
    labelSettings: {
      text:
        "[fontSize:1.5em]2016 BREAKDOWN OF\nTHE U.S.CORPORATE CASH PILE\n \n[/]NON-FINANCIAL COMPANIES \n [bold]$1,768 TRILLION[/]",
      rotation: 0
    }
  },

  {
    from: "Total non financial companies",
    to: "Non-tech companies",
    value: 907,
    labelSettings: { text: "NON-TECH COMPANIES\n [bold]$907 BILLION[/]" }
  },
  {
    from: "Total non financial companies",
    to: "Tech companies",
    value: 861,
    labelSettings: { text: "TECH COMPANIES\n [bold]861 BILLION[/]" }
  },

  { from: "Non-tech companies", to: "Cash in the U.S.", value: 324 },
  { from: "Non-tech companies", to: "Cash Overseas", value: 584 },

  {
    from: "Tech companies",
    to: "Rest of tech",
    value: 274,
    labelSettings: { text: "REST OF TECH\n[bold]$274 BILLION[/]" }
  },
  {
    from: "Tech companies",
    to: "Top 5 tech companies",
    value: 587,
    labelSettings: { text: "TOP 5 TECH COMPANIES\n[bold]$587 BILLION[/]" }
  },

  { from: "Rest of tech", to: "Cash in the U.S.", value: 74 },
  { from: "Rest of tech", to: "Cash Overseas", value: 200 },

  {
    from: "Top 5 tech companies",
    to: "Joytechs",
    value: 67,
    labelSettings2: {
      dx: 60,
      centerX: am5.p100,
      text: "JOYTECHS [bold]$67[/]B"
    }
  },
  { from: "Joytechs", to: "Cash in the U.S.", value: 10 },
  { from: "Joytechs", to: "Cash Overseas", value: 57 },

  {
    from: "Top 5 tech companies",
    to: "Fireex",
    value: 68,
    labelSettings2: { dx: 60, centerX: am5.p100, text: "FIREEX [bold]$68[/]B" }
  },
  { from: "Fireex", to: "Cash in the U.S.", value: 8 },
  { from: "Fireex", to: "Cash Overseas", value: 60 },

  {
    from: "Top 5 tech companies",
    to: "Globalworld",
    value: 85,
    labelSettings2: {
      dx: 60,
      centerX: am5.p100,
      text: "GLOBALWORLD [bold]$85[/]B"
    }
  },
  { from: "Globalworld", to: "Cash in the U.S.", value: 10 },
  { from: "Globalworld", to: "Cash Overseas", value: 75 },

  {
    from: "Top 5 tech companies",
    to: "Betagate",
    value: 115,
    labelSettings2: {
      dx: 60,
      centerX: am5.p100,
      text: "BETAGATE [bold]$115[/]B"
    }
  },
  { from: "Betagate", to: "Cash in the U.S.", value: 10 },
  { from: "Betagate", to: "Cash Overseas", value: 105 },

  {
    from: "Top 5 tech companies",
    to: "Apexi",
    value: 253,
    labelSettings2: { dx: 60, centerX: am5.p100, text: "APEXI [bold]$253[/]B" }
  },
  { from: "Apexi", to: "Cash in the U.S.", value: 23 },
  { from: "Apexi", to: "Cash Overseas", value: 230 }
]);

// Make stuff animate on load
series.appear(1000, 100);

}); // end am5.ready()
</script>

<!-- HTML -->
<div id="chartdiv"></div>