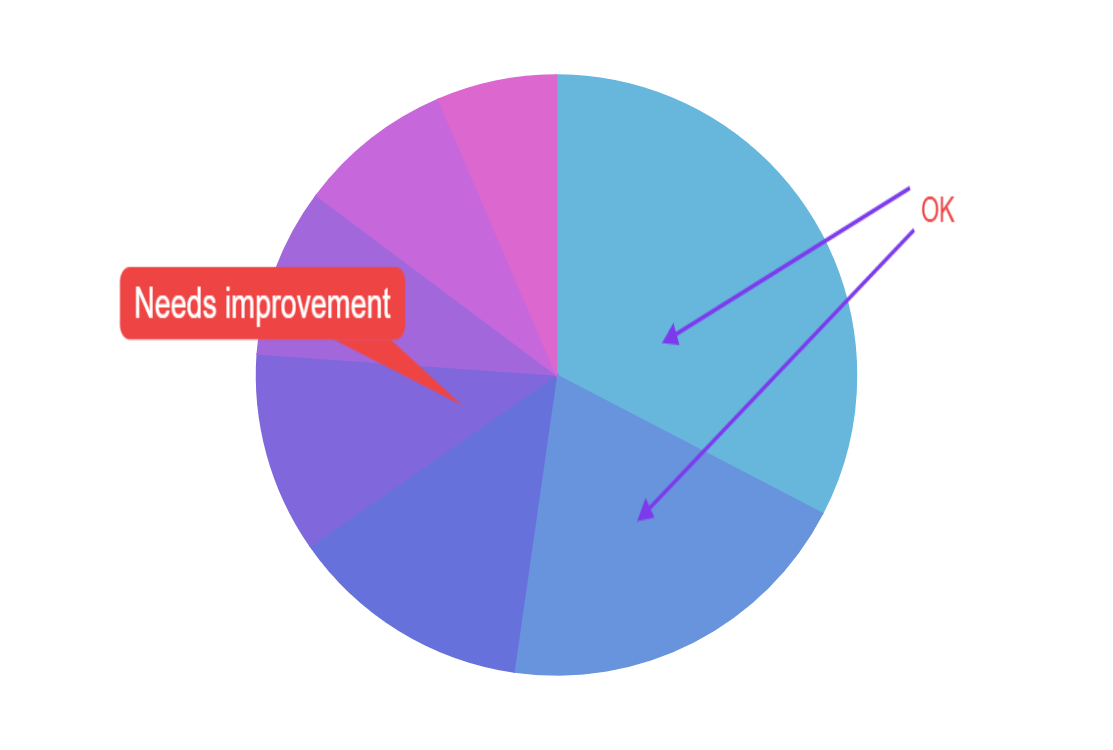
Annotating Charts
Exporting plugin includes Annotator tool, which can be used to annotations to any chart using simple user interface.
Related tutorials
Demo source
<!-- Styles -->
<style>
#chartdiv {
  width: 100%;
  height: 500px;
}
</style>

<!-- Resources -->
<script src="https://cdn.amcharts.com/lib/5/index.js"></script>
<script src="https://cdn.amcharts.com/lib/5/percent.js"></script>
<script src="https://cdn.amcharts.com/lib/5/themes/Animated.js"></script>
<script src="https://cdn.amcharts.com/lib/5/plugins/exporting.js"></script>

<!-- Chart code -->
<script>
am5.ready(function() {

// Create root element
// https://www.amcharts.com/docs/v5/getting-started/#Root_element
var root = am5.Root.new("chartdiv");

// Set themes
// https://www.amcharts.com/docs/v5/concepts/themes/
root.setThemes([
  am5themes_Animated.new(root)
]);

// Create chart
// https://www.amcharts.com/docs/v5/charts/percent-charts/pie-chart/
var chart = root.container.children.push(
  am5percent.PieChart.new(root, {
    endAngle: 270
  })
);

// Create series
// https://www.amcharts.com/docs/v5/charts/percent-charts/pie-chart/#Series
var series = chart.series.push(
  am5percent.PieSeries.new(root, {
    valueField: "value",
    categoryField: "category",
    endAngle: 270
  })
);

series.states.create("hidden", {
  endAngle: -90
});

series.labels.template.set("forceHidden", true);
series.ticks.template.set("forceHidden", true);

// Set data
// https://www.amcharts.com/docs/v5/charts/percent-charts/pie-chart/#Setting_data
series.data.setAll([{
  category: "Lithuania",
  value: 501.9
}, {
  category: "Czechia",
  value: 301.9
}, {
  category: "Ireland",
  value: 201.1
}, {
  category: "Germany",
  value: 165.8
}, {
  category: "Australia",
  value: 139.9
}, {
  category: "Austria",
  value: 128.3
}, {
  category: "UK",
  value: 99
}]);

series.appear(1000, 100);

// Set up export and annotation
var exporting = am5plugins_exporting.Exporting.new(root, {
  menu: am5plugins_exporting.ExportingMenu.new(root, {})
});

var annotationData = {"width":897,"height":500,"markers":[{"bgColor":"#EF4444","tipPosition":{"x":276.00001525878906,"y":92.33334350585938},"color":"#FFFFFF","fontFamily":"Helvetica, Arial, sans-serif","padding":5,"text":"Needs improvement","left":96.66667175292969,"top":178,"width":230,"height":48.333343505859375,"rotationAngle":0,"visualTransformMatrix":{"a":1,"b":0,"c":0,"d":1,"e":0,"f":0},"containerTransformMatrix":{"a":1,"b":0,"c":0,"d":1,"e":0,"f":0},"typeName":"CalloutMarker","state":"select"},{"arrowType":"end","strokeColor":"#7C3AED","strokeWidth":3,"strokeDasharray":"","x1":733.3333740234375,"y1":125.33334350585938,"x2":539.3333740234375,"y2":225.6666717529297,"typeName":"ArrowMarker","state":"select"},{"arrowType":"end","strokeColor":"#7C3AED","strokeWidth":3,"strokeDasharray":"","x1":736.6666870117188,"y1":153.33334350585938,"x2":518.6666870117188,"y2":343.0000915527344,"typeName":"ArrowMarker","state":"select"},{"color":"#EF4444","fontFamily":"Helvetica, Arial, sans-serif","padding":5,"text":"OK","left":706.0000610351562,"top":125.00001525878906,"width":100,"height":30,"rotationAngle":0,"visualTransformMatrix":{"a":1,"b":0,"c":0,"d":1,"e":0,"f":0},"containerTransformMatrix":{"a":1,"b":0,"c":0,"d":1,"e":0,"f":0},"typeName":"TextMarker","state":"select"}]};

var annotator = am5plugins_exporting.Annotator.new(root, {
  markerState: annotationData
});

var menuitems = exporting.get("menu").get("items");

menuitems.push({
  type: "separator"
});

menuitems.push({
  type: "custom",
  label: "Annotate",
  callback: function() {
    this.close();
    annotator.toggle();
  }
});

}); // end am5.ready()
</script>

<!-- HTML -->
<div id="chartdiv"></div>