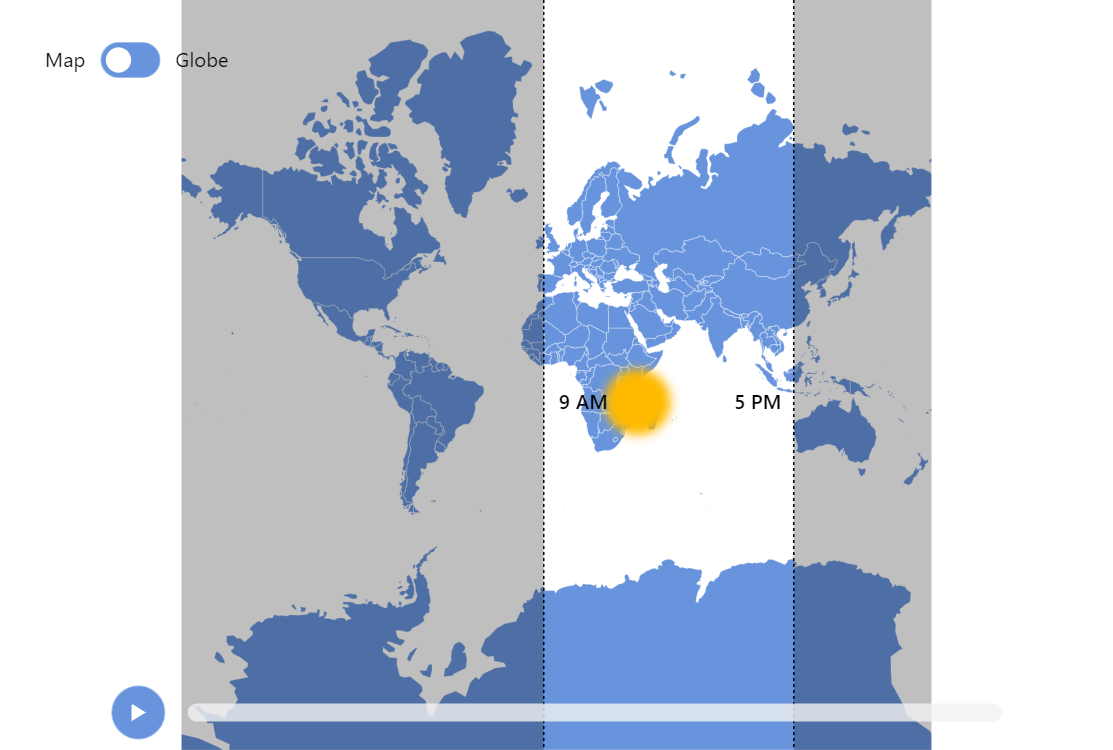
Approximate Working Hours Map
This demo showcases a way to highlight a specific time band on a map. In this specific case we display areas where it is working hours at the moment based on current time.
Key implementation details
The sun is a couple of bullets on a MapPointSeries: one represents a pulsating blurred outer edge, and the other is the static center on top of it.
We highlight the day region by covering the night areas with semi-transparent polygons in MapPolygonSeries.
Related tutorials
Demo source
<!-- Styles -->
<style>
#chartdiv {
  width: 100%;
  height: 600px;
  max-width: 100%;
  background-color: #454a58;
}
</style>

<!-- Resources -->
<script src="https://cdn.amcharts.com/lib/5/index.js"></script>
<script src="https://cdn.amcharts.com/lib/5/map.js"></script>
<script src="https://cdn.amcharts.com/lib/5/geodata/worldLow.js"></script>
<script src="https://cdn.amcharts.com/lib/5/themes/Animated.js"></script>

<!-- Chart code -->
<script>
am5.ready(function() {

// Create root element
// https://www.amcharts.com/docs/v5/getting-started/#Root_element
var root = am5.Root.new("chartdiv");

// Set themes
// https://www.amcharts.com/docs/v5/concepts/themes/
root.setThemes([
  am5themes_Animated.new(root)
]);

// Create the map chart
// https://www.amcharts.com/docs/v5/charts/map-chart/
var chart = root.container.children.push(am5map.MapChart.new(root, {
  panX: "rotateX",
  panY: "rotateY",
  projection: am5map.geoMercator()
}));

// Create series for background fill
// https://www.amcharts.com/docs/v5/charts/map-chart/map-polygon-series/#Background_polygon
var backgroundSeries = chart.series.push(am5map.MapPolygonSeries.new(root, {}));
backgroundSeries.mapPolygons.template.setAll({
  fill: root.interfaceColors.get("alternativeBackground"),
  fillOpacity: 0,
  strokeOpacity: 0
});
// Add background polygo
// https://www.amcharts.com/docs/v5/charts/map-chart/map-polygon-series/#Background_polygon
backgroundSeries.data.push({
  geometry: am5map.getGeoRectangle(90, 180, -90, -180)
});

// Create main polygon series for countries
// https://www.amcharts.com/docs/v5/charts/map-chart/map-polygon-series/
var polygonSeries = chart.series.push(am5map.MapPolygonSeries.new(root, {
  geoJSON: am5geodata_worldLow
}));

// Create point series for Sun icon
// https://www.amcharts.com/docs/v5/charts/map-chart/map-point-series/
var sunSeries = chart.series.push(am5map.MapPointSeries.new(root, {}));

sunSeries.bullets.push(function () {
  var circle = am5.Circle.new(root, {
    radius: 18,
    fill: am5.color(0xffba00),
    filter: "blur(5px)"
  });

  circle.animate({
    key: "radius",
    duration: 2000,
    to: 23,
    loops: Infinity,
    easing: am5.ease.yoyo(am5.ease.linear)
  });

  return am5.Bullet.new(root, {
    sprite: circle
  });
});

sunSeries.bullets.push(function () {
  return am5.Bullet.new(root, {
    sprite: am5.Circle.new(root, {
      radius: 14,
      fill: am5.color(0xffba00)
    })
  });
});

var sunDataItem = sunSeries.pushDataItem({});

// Create polygon series for night-time polygons
// https://www.amcharts.com/docs/v5/charts/map-chart/map-polygon-series/
var nightSeries = chart.series.push(am5map.MapPolygonSeries.new(root, {}));

nightSeries.mapPolygons.template.setAll({
  fill: am5.color(0x000000),
  fillOpacity: 0.25,
  strokeOpacity: 0
});

var nightDataItem = nightSeries.pushDataItem({});

// Create line series for lines at 9 and 17 o'clock
// https://www.amcharts.com/docs/v5/charts/map-chart/map-line-series/
var lineSeries = chart.series.push(am5map.MapLineSeries.new(root, {}));

lineSeries.mapLines.template.setAll({
  stroke: root.interfaceColors.get("alternativeBackground"),
  strokeOpacity: 1,
  strokeDasharray: [2, 2]
});

var nineLine = lineSeries.pushDataItem({});
var fiveLine = lineSeries.pushDataItem({});

// create point series for labels
// https://www.amcharts.com/docs/v5/charts/map-chart/map-point-series/
var pointSeries = chart.series.push(am5map.MapPointSeries.new(root, {}));

pointSeries.bullets.push(function () {
  return am5.Bullet.new(root, {
    sprite: am5.Label.new(root, { templateField: "labelConfig" })
  });
});

var ninePoint = pointSeries.pushDataItem({});
ninePoint.dataContext = {
  labelConfig: { text: "9 AM", fontWeight: "600", centerY: am5.p50 }
};

var fivePoint = pointSeries.pushDataItem({});
fivePoint.dataContext = {
  labelConfig: {
    text: "5 PM",
    fontWeight: "600",
    centerX: am5.p100,
    centerY: am5.p50
  }
};

// Create controls
var container = chart.children.push(am5.Container.new(root, {
  y: am5.percent(95),
  centerX: am5.p50,
  x: am5.p50,
  width: am5.percent(80),
  layout: root.horizontalLayout
}));

var playButton = container.children.push(am5.Button.new(root, {
  themeTags: ["play"],
  centerY: am5.p50,
  marginRight: 15,
  icon: am5.Graphics.new(root, {
    themeTags: ["icon"]
  })
}));

playButton.events.on("click", function () {
  if (playButton.get("active")) {
    slider.set("start", slider.get("start") + 0.0001);
  } else {
    slider.animate({
      key: "start",
      to: 1,
      duration: 15000 * (1 - slider.get("start"))
    });
  }
});

var slider = container.children.push(
  am5.Slider.new(root, {
    orientation: "horizontal",
    start: 0.5,
    centerY: am5.p50
  })
);

slider.on("start", function (start) {
  if (start === 1) {
    playButton.set("active", false);
  }
});

slider.events.on("rangechanged", function () {
  updateDateNight(
    (slider.get("start", 0) - 0.5) * am5.time.getDuration("day", 2) +
      new Date().getTime()
  );
});

var cont = chart.children.push(
  am5.Container.new(root, {
    layout: root.horizontalLayout,
    x: 20,
    y: 40
  })
);

cont.children.push(
  am5.Label.new(root, {
    centerY: am5.p50,
    text: "Map"
  })
);

var switchButton = cont.children.push(
  am5.Button.new(root, {
    themeTags: ["switch"],
    centerY: am5.p50,
    icon: am5.Circle.new(root, {
      themeTags: ["icon"]
    })
  })
);

switchButton.on("active", function () {
  if (!switchButton.get("active")) {
    chart.set("projection", am5map.geoMercator());
    backgroundSeries.mapPolygons.template.set("fillOpacity", 0);
  } else {
    chart.set("projection", am5map.geoOrthographic());
    backgroundSeries.mapPolygons.template.set("fillOpacity", 0.1);
  }
});
cont.children.push(
  am5.Label.new(root, {
    centerY: am5.p50,
    text: "Globe"
  })
);

chart.appear(1000, 100);

function updateDateNight(time) {
  var sunPosition = solarPosition(time);
  sunDataItem.set("longitude", sunPosition.longitude);
  sunDataItem.set("latitude", sunPosition.latitude);

  var nightPosition = {
    longitude: sunPosition.longitude + 180,
    latitude: -sunPosition.latitude
  };

  var nineLongitude = sunPosition.longitude - 15 * 3; // 3 hours from 12 to 9
  var fiveLongitude = sunPosition.longitude + 15 * 5; // 5 hours from 12 to 17
  var max = 89.999;

  var multipolygon = [];
  for (var i = nineLongitude; i > fiveLongitude - 360; i = i - 10) {
    var longitude = i;
    if (longitude > 180) {
      longitude -= 360;
    }
    multipolygon.push([
      [
        [i - 10, -max],
        [i - 10, 0],
        [i - 10, max],
        [i, max],
        [i, 0],
        [i, -max]
      ]
    ]);
  }

  nightDataItem.set("geometry", {
    type: "MultiPolygon",
    coordinates: multipolygon
  });

  nineLine.set("geometry", {
    type: "MultiLineString",
    coordinates: [
      [
        [nineLongitude, max],
        [nineLongitude, -max]
      ]
    ]
  });
  fiveLine.set("geometry", {
    type: "MultiLineString",
    coordinates: [
      [
        [fiveLongitude, max],
        [fiveLongitude, -max]
      ]
    ]
  });

  ninePoint.set("longitude", nineLongitude);
  fivePoint.set("longitude", fiveLongitude);

  ninePoint.set("latitude", sunPosition.latitude);
  fivePoint.set("latitude", sunPosition.latitude);
}

var offset = new Date().getTimezoneOffset() * 60 * 1000;

// all sun position calculation is taken from: http://bl.ocks.org/mbostock/4597134
function solarPosition(time) {
  var centuries = (time - Date.UTC(2000, 0, 1, 12)) / 864e5 / 36525; // since J2000
  var longitude =
    ((am5.time.round(new Date(time), "day", 1).getTime() - time - offset) /
      864e5) *
      360 -
    180;

  return am5map.normalizeGeoPoint({
    longitude: longitude - equationOfTime(centuries) * am5.math.DEGREES,
    latitude: solarDeclination(centuries) * am5.math.DEGREES
  });
}

// Equations based on NOAA’s Solar Calculator; all angles in RADIANS.
// http://www.esrl.noaa.gov/gmd/grad/solcalc/

function equationOfTime(centuries) {
  var e = eccentricityEarthOrbit(centuries),
    m = solarGeometricMeanAnomaly(centuries),
    l = solarGeometricMeanLongitude(centuries),
    y = Math.tan(obliquityCorrection(centuries) / 2);

  y *= y;
  return (
    y * Math.sin(2 * l) -
    2 * e * Math.sin(m) +
    4 * e * y * Math.sin(m) * Math.cos(2 * l) -
    0.5 * y * y * Math.sin(4 * l) -
    1.25 * e * e * Math.sin(2 * m)
  );
}

function solarDeclination(centuries) {
  return Math.asin(
    Math.sin(obliquityCorrection(centuries)) *
      Math.sin(solarApparentLongitude(centuries))
  );
}

function solarApparentLongitude(centuries) {
  return (
    solarTrueLongitude(centuries) -
    (0.00569 +
      0.00478 * Math.sin((125.04 - 1934.136 * centuries) * am5.math.RADIANS)) *
      am5.math.RADIANS
  );
}

function solarTrueLongitude(centuries) {
  return (
    solarGeometricMeanLongitude(centuries) + solarEquationOfCenter(centuries)
  );
}

function solarGeometricMeanAnomaly(centuries) {
  return (
    (357.52911 + centuries * (35999.05029 - 0.0001537 * centuries)) *
    am5.math.RADIANS
  );
}

function solarGeometricMeanLongitude(centuries) {
  var l = (280.46646 + centuries * (36000.76983 + centuries * 0.0003032)) % 360;
  return ((l < 0 ? l + 360 : l) / 180) * Math.PI;
}

function solarEquationOfCenter(centuries) {
  var m = solarGeometricMeanAnomaly(centuries);
  return (
    (Math.sin(m) * (1.914602 - centuries * (0.004817 + 0.000014 * centuries)) +
      Math.sin(m + m) * (0.019993 - 0.000101 * centuries) +
      Math.sin(m + m + m) * 0.000289) *
    am5.math.RADIANS
  );
}

function obliquityCorrection(centuries) {
  return (
    meanObliquityOfEcliptic(centuries) +
    0.00256 *
      Math.cos((125.04 - 1934.136 * centuries) * am5.math.RADIANS) *
      am5.math.RADIANS
  );
}

function meanObliquityOfEcliptic(centuries) {
  return (
    (23 +
      (26 +
        (21.448 -
          centuries * (46.815 + centuries * (0.00059 - centuries * 0.001813))) /
          60) /
        60) *
    am5.math.RADIANS
  );
}

function eccentricityEarthOrbit(centuries) {
  return 0.016708634 - centuries * (0.000042037 + 0.0000001267 * centuries);
}

}); // end am5.ready()
</script>

<!-- HTML -->
<div id="chartdiv"></div>