Area with Time Based Data
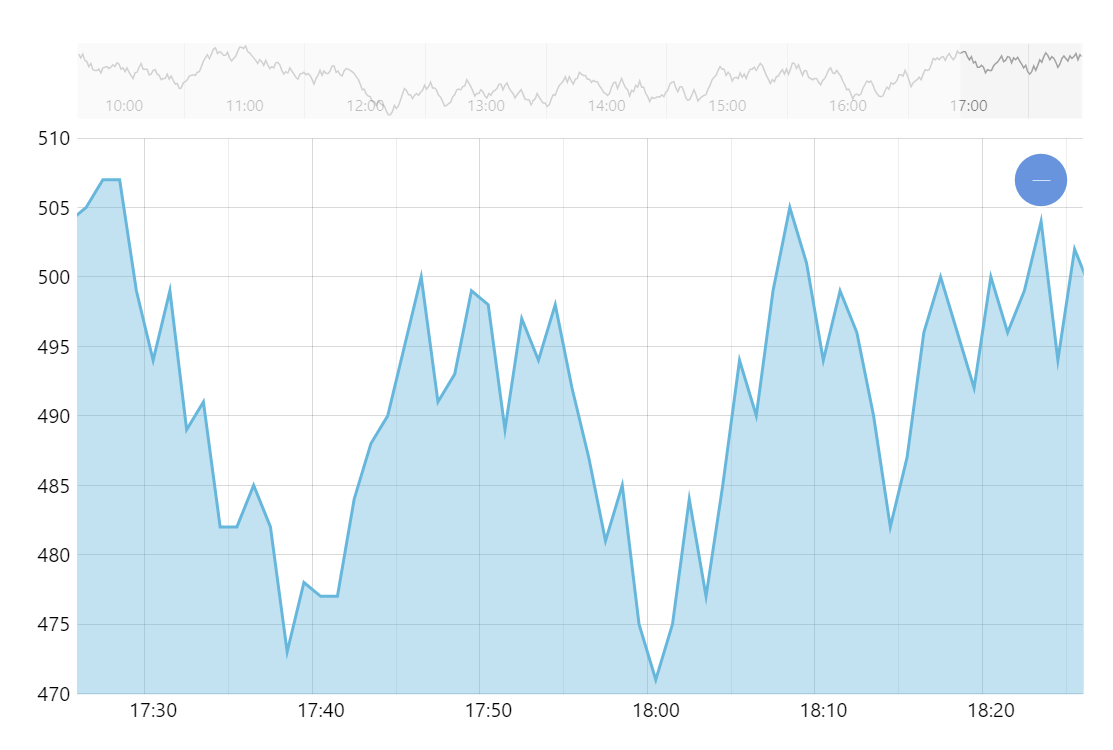
This demo shows you how to create a time-based area chart with amCharts 5.
Key implementation details
We create an XY chart with DateAxis as its X axis. The base interval on it is set to minutes, as this is the type of data we have. We add a LineSeries to the chart and set its fills.template to visible so we get an area chart as a result.
Related tutorials
Demo source
<!-- Styles -->
<style>
#chartdiv {
  width: 100%;
  height: 500px;
}
</style>

<!-- Resources -->
<script src="https://cdn.amcharts.com/lib/5/index.js"></script>
<script src="https://cdn.amcharts.com/lib/5/xy.js"></script>
<script src="https://cdn.amcharts.com/lib/5/themes/Animated.js"></script>

<!-- Chart code -->
<script>
am5.ready(function() {


// Create root and chart
var root = am5.Root.new("chartdiv");

root.setThemes([
  am5themes_Animated.new(root)
]);

var chart = root.container.children.push(am5xy.XYChart.new(root, {
  panX: true,
  panY: true,
  wheelY: "zoomX",
  layout: root.verticalLayout,
  pinchZoomX: true
}));

// Create Y-axis
var yAxis = chart.yAxes.push(am5xy.ValueAxis.new(root, {
  maxDeviation: 1,
  renderer: am5xy.AxisRendererY.new(root, {
    pan: "zoom"
  })
}));

// Create X-Axis
var xAxis = chart.xAxes.push(am5xy.DateAxis.new(root, {
  groupData: true,
  maxDeviation: 0.5,
  baseInterval: { timeUnit: "minute", count: 1 },
  renderer: am5xy.AxisRendererX.new(root, {
    minGridDistance: 60,
    pan: "zoom",
    minorGridEnabled: true
  })
}));

// xAxis.get("dateFormats")["day"] = "MM/dd";
// xAxis.get("periodChangeDateFormats")["day"] = "MMMM";

// Generate random data
function generateChartData() {
  var chartData = [];
  // current date
  var firstDate = new Date();
  // now set 500 minutes back
  firstDate.setMinutes(firstDate.getDate() - 500, 0, 0);

  // and generate 500 data items
  var visits = 500;
  for (var i = 0; i < 500; i++) {
    var newDate = new Date(firstDate);
    // each time we add one minute
    newDate.setMinutes(newDate.getMinutes() + i);
    // some random number
    visits += Math.round((Math.random() < 0.5 ? 1 : -1) * Math.random() * 10);
    // add data item to the array
    chartData.push({
      date: newDate.getTime(),
      visits: visits
    });
  }
  return chartData;
}
var data = generateChartData();

// Create series
var series = chart.series.push(am5xy.LineSeries.new(root, {
  name: "Series",
  xAxis: xAxis,
  yAxis: yAxis,
  valueYField: "visits",
  valueXField: "date",
  tooltip: am5.Tooltip.new(root, {
    pointerOrientation: "horizontal",
    labelText: "[bold]{name}[/]\n{valueX.formatDate()}: {valueY}"
  })
}));

series.strokes.template.set("strokeWidth", 2);
series.fills.template.setAll({
  visible: true,
  fillOpacity: 0.4
});

series.data.setAll(data);

// Pre-zoom X axis to last hour
series.events.once("datavalidated", function (ev, target) {
  var lastDate = new Date(data[data.length - 1].date);
  var firstDate = new Date(lastDate.getTime() - 3600000);
  xAxis.zoomToDates(firstDate, lastDate);
})

// Add cursor
chart.set("cursor", am5xy.XYCursor.new(root, {
  behavior: "none",
  xAxis: xAxis
}));

xAxis.set("tooltip", am5.Tooltip.new(root, {}));

yAxis.set("tooltip", am5.Tooltip.new(root, {}));


var scrollbarX = am5xy.XYChartScrollbar.new(root, {
  orientation: "horizontal",
  height: 50
});

chart.set("scrollbarX", scrollbarX);

var sbxAxis = scrollbarX.chart.xAxes.push(am5xy.DateAxis.new(root, {
  baseInterval: { timeUnit: "minute", count: 1 },
  renderer: am5xy.AxisRendererX.new(root, {
    opposite: false,
    strokeOpacity: 0,
    minorGridEnabled: true,
    minGridDistance: 60
  })
}));

var sbyAxis = scrollbarX.chart.yAxes.push(am5xy.ValueAxis.new(root, {
  renderer: am5xy.AxisRendererY.new(root, {})
}));

var sbseries = scrollbarX.chart.series.push(am5xy.LineSeries.new(root, {
  xAxis: sbxAxis,
  yAxis: sbyAxis,
  valueYField: "visits",
  valueXField: "date"
}));
sbseries.data.setAll(data);

}); // end am5.ready()
</script>

<!-- HTML -->
<div id="chartdiv"></div>