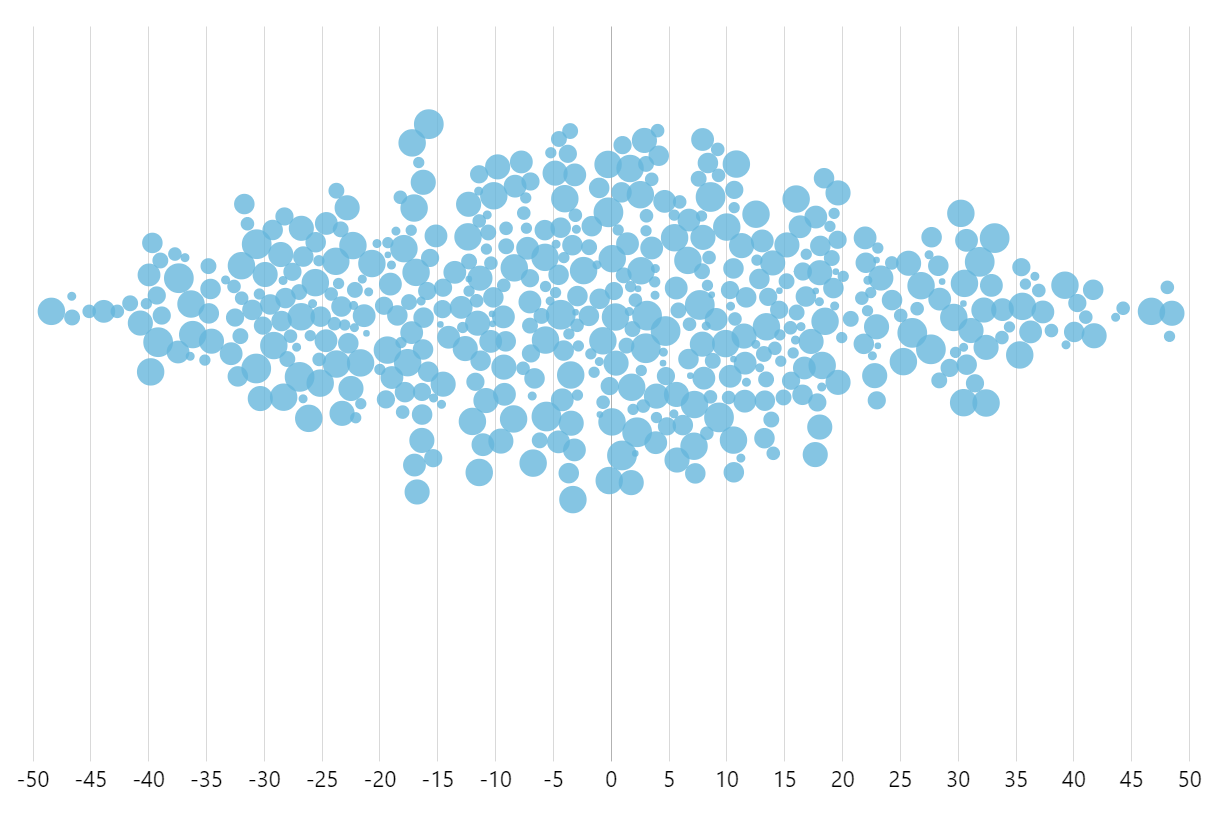
Beeswarm
A beeswarm chart, also known as a “dot plot,” is a data visualization technique used to display the distribution of a dataset along a single axis. In a beeswarm chart, individual data points are represented as dots or circles, and they are arranged in a way that avoids overlap while maintaining their alignment along the axis.
This arrangement allows for easy visualization of the density and distribution of data points, making it useful for understanding patterns, outliers, and overall trends within a dataset. Beeswarm charts are particularly effective for visualizing small to moderate-sized datasets and are commonly used in statistics, data analysis, and scientific research.
This demo uses a regular XYChart together with D3 “Force” library, to apply collision prevention of the bullets.
For a vertical version of this chart on CodePen click here.
Related tutorials
Demo source
<!-- Styles -->
<style>
#chartdiv {
  width: 100%;
  height: 400px;
}
</style>

<!-- Resources -->
<script src="https://cdn.amcharts.com/lib/5/index.js"></script>
<script src="https://cdn.amcharts.com/lib/5/xy.js"></script>
<script src="https://cdn.amcharts.com/lib/5/themes/Animated.js"></script>
<script src="https://cdnjs.cloudflare.com/ajax/libs/d3/7.8.5/d3.min.js"></script>

<!-- Chart code -->
<script>
am5.ready(function() {

// Create D3 simulation and collision force
var simulation = d3.forceSimulation();
var collisionForce = d3.forceCollide();

// Update bullet positions on tick
simulation.on("tick", function() {
  updatePositions();
});

// Updated bullet positions
function updatePositions() {
  am5.array.each(nodes, function(node) {
    var circle = node.circle;

    // Instead of setting `y` we use `dy`, as `y` is set by the chart
    // each time chart changes its size or something else changes
    circle.setAll({
      dy: node.y - circle.y()
    });

    node.fx = circle.x(); // `y` might change when div changes its size
  });
}


// Nodes array which will be used by simulation
var nodes = [];

// Adds nodes to the nodes array
function addNode(dataItem) {
  var bullets = dataItem.bullets;
  if (bullets) {
    var bullet = bullets[0];
    if (bullet) {
      var circle = bullet.get("sprite");

      if (circle) {
        // We use `fx` for horizontal position as we don't want `x` to change.
        // For a vertical chart, set `fx` instead of `fy`
        var node = {
          fx: circle.x(),
          y: circle.y(),
          circle: circle
        };
        nodes.push(node);
      }
    }
  }
}

// Updates collision forces
function updateForces() {
  simulation.force("collision", collisionForce);

  collisionForce.radius(function(node) {
    var circle = node.circle;
    return circle.get("radius", 1) + 1; // 1 add 1 for padding
  });
}


// Create root element
// https://www.amcharts.com/docs/v5/getting-started/#Root_element
var root = am5.Root.new("chartdiv");

// Set themes
// https://www.amcharts.com/docs/v5/concepts/themes/
root.setThemes([
  am5themes_Animated.new(root)
]);


// Create chart
// https://www.amcharts.com/docs/v5/charts/xy-chart/
var chart = root.container.children.push(am5xy.XYChart.new(root, {
  panX: true,
  panY: true,
  wheelY: "zoomXY",
  pinchZoomX: true,
  pinchZoomY: true
}));


// Create axes
// https://www.amcharts.com/docs/v5/charts/xy-chart/axes/
var xAxis = chart.xAxes.push(am5xy.ValueAxis.new(root, {
  renderer: am5xy.AxisRendererX.new(root, {
    minGridDistance:30
  }),
  extraMin:0.01,
  extraMax:0.01,

}));

//xAxis.get("renderer").grid.template.set("forceHidden", true);

var yAxis = chart.yAxes.push(am5xy.ValueAxis.new(root, {
  renderer: am5xy.AxisRendererY.new(root, {}),
  visible: false
}));

yAxis.get("renderer").grid.template.set("forceHidden", true);

// Create series
// https://www.amcharts.com/docs/v5/charts/xy-chart/series/
var series = chart.series.push(am5xy.LineSeries.new(root, {
  calculateAggregates: true,
  xAxis: xAxis,
  yAxis: yAxis,
  valueYField: "y",
  valueXField: "x",
  valueField: "value"
}));

series.strokes.template.set("visible", false);


// Add bullet
// https://www.amcharts.com/docs/v5/charts/xy-chart/series/#Bullets
var circleTemplate = am5.Template.new({});

series.bullets.push(function() {
  var bulletCircle = am5.Circle.new(root, {
    radius: 5,
    fill: series.get("fill"),
    fillOpacity: 0.8,
    tooltipText: "{x}",
    tooltipY: 0,
  }, circleTemplate);

  bulletCircle.states.create("hover", {
    fill: chart.get("colors").getIndex(4)
  })

  return am5.Bullet.new(root, {
    sprite: bulletCircle
  });
});


// Add heat rule
// https://www.amcharts.com/docs/v5/concepts/settings/heat-rules/
// this makes radius different, depending on the value.
// remove if you want all circles to be of the same size
series.set("heatRules", [{
  target: circleTemplate,
  min: 2,
  max: 9,
  dataField: "value",
  key: "radius"
}]);

// Set data
// https://www.amcharts.com/docs/v5/charts/xy-chart/series/#Setting_data

// Generate random data
var data = [];
for (var i = 0; i < 500; i++) {
  data.push({
    x: am5.math.round(Math.random() * 50 - Math.random() * 50, 2),
    y: 0,
    value: Math.round(Math.random() * 10)
  });
}

series.data.setAll(data);

// Update forces whenever data is parsed
series.events.on("datavalidated", function() {
  // Needs a timeout as bullets are created a bit later
  setTimeout(function() {
    am5.array.each(series.dataItems, function(dataItem) {
      addNode(dataItem);
    })
    simulation.nodes(nodes);
    updateForces();
  }, 500)
});

// Update bullet positions when chart bounds change
chart.plotContainer.events.on("boundschanged", function() {
  updateForces();
  simulation.restart();
});


// Make stuff animate on load
// https://www.amcharts.com/docs/v5/concepts/animations/
chart.appear(1000, 100);

}); // end am5.ready()
</script>

<!-- HTML -->
<div id="chartdiv"></div>