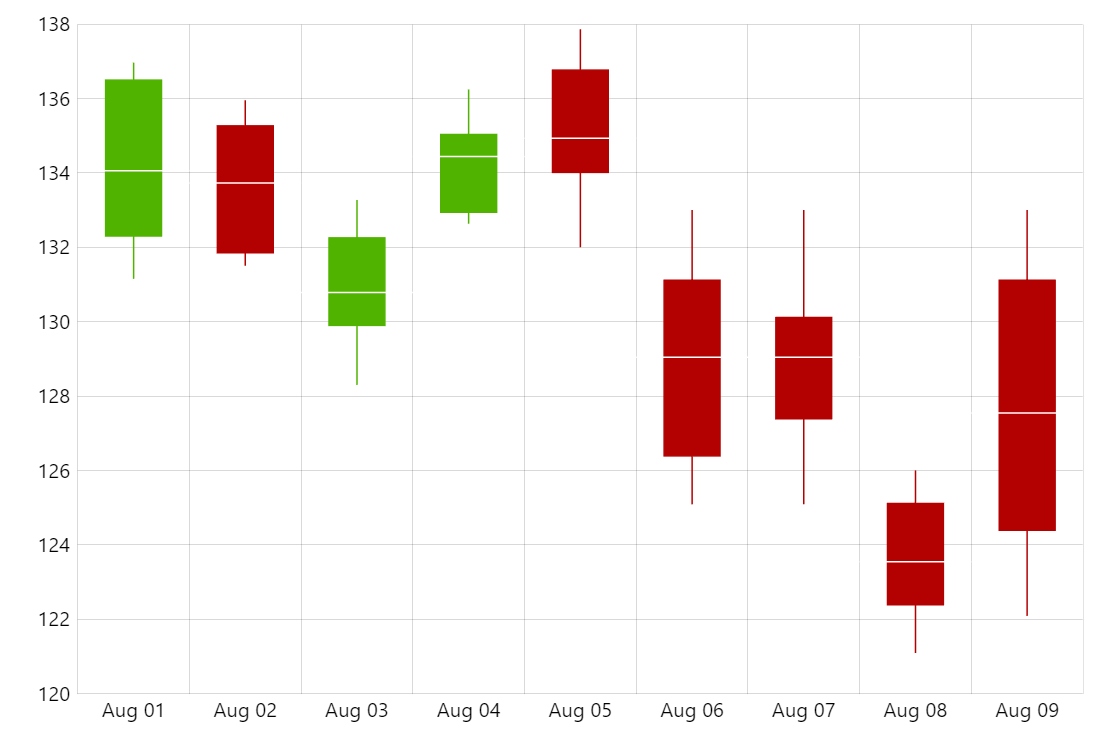
Box Plot Chart
Box plot chart (also know as boxplot, box-and-whisker plot, box-and-whisker diagram) is a way of displaying statistical data based on five numbers: minimum, first quartile (25th percent), median, third quartile (75th percent) and maximum.
Related tutorials
Demo source
<!-- Styles -->
<style>
#chartdiv {
  width: 100%;
  height: 400px;
}
</style>

<!-- Resources -->
<script src="https://cdn.amcharts.com/lib/5/index.js"></script>
<script src="https://cdn.amcharts.com/lib/5/xy.js"></script>
<script src="https://cdn.amcharts.com/lib/5/themes/Animated.js"></script>

<!-- Chart code -->
<script>
am5.ready(function() {

// Create root element
// https://www.amcharts.com/docs/v5/getting-started/#Root_element
var root = am5.Root.new("chartdiv");

// Set themes
// https://www.amcharts.com/docs/v5/concepts/themes/
root.setThemes([
  am5themes_Animated.new(root)
]);

// Create chart
// https://www.amcharts.com/docs/v5/charts/xy-chart/
var chart = root.container.children.push(
  am5xy.XYChart.new(root, {
    focusable: true,
    panX: true,
    panY: true,
    wheelX: "panX",
    wheelY: "zoomX"
  })
);

// Create axes
// https://www.amcharts.com/docs/v5/charts/xy-chart/axes/
var xAxis = chart.xAxes.push(
  am5xy.DateAxis.new(root, {
    baseInterval: { timeUnit: "day", count: 1 },
    renderer: am5xy.AxisRendererX.new(root, {
      pan: "zoom",
      minorGridEnabled: true,
      minGridDistance: 70
    }),
    tooltip: am5.Tooltip.new(root, {})
  })
);

var yAxis = chart.yAxes.push(
  am5xy.ValueAxis.new(root, {
    renderer: am5xy.AxisRendererY.new(root, {
      pan: "zoom"
    })
  })
);

var color = root.interfaceColors.get("background");

// Add series
// https://www.amcharts.com/docs/v5/charts/xy-chart/series/
var series = chart.series.push(
  am5xy.CandlestickSeries.new(root, {
    fill: color,
    stroke: color,
    name: "MDXI",
    xAxis: xAxis,
    yAxis: yAxis,
    valueYField: "close",
    openValueYField: "open",
    lowValueYField: "low",
    highValueYField: "high",
    valueXField: "date",
    tooltip: am5.Tooltip.new(root, {
      pointerOrientation: "horizontal",
      labelText: "open: {openValueY}\nlow: {lowValueY}\nhigh: {highValueY}\nclose: {valueY},\nmediana: {mediana}"
    })
  })
);

// mediana series
var medianaSeries = chart.series.push(
  am5xy.StepLineSeries.new(root, {
    stroke: root.interfaceColors.get("background"),
    xAxis: xAxis,
    yAxis: yAxis,
    valueYField: "mediana",
    valueXField: "date",
    noRisers: true
  })
);

// Add cursor
// https://www.amcharts.com/docs/v5/charts/xy-chart/cursor/
var cursor = chart.set("cursor", am5xy.XYCursor.new(root, {
  xAxis: xAxis
}));
cursor.lineY.set("visible", false);

var data = [
  {
    date: "2019-08-01",
    open: 132.3,
    high: 136.96,
    low: 131.15,
    close: 136.49
  },
  {
    date: "2019-08-02",
    open: 135.26,
    high: 135.95,
    low: 131.5,
    close: 131.85
  },
  {
    date: "2019-08-03",
    open: 129.9,
    high: 133.27,
    low: 128.3,
    close: 132.25
  },
  {
    date: "2019-08-04",
    open: 132.94,
    high: 136.24,
    low: 132.63,
    close: 135.03
  },
  {
    date: "2019-08-05",
    open: 136.76,
    high: 137.86,
    low: 132.0,
    close: 134.01
  },
  {
    date: "2019-08-06",
    open: 131.11,
    high: 133.0,
    low: 125.09,
    close: 126.39
  },
  {
    date: "2019-08-07",
    open: 130.11,
    high: 133.0,
    low: 125.09,
    close: 127.39
  },
  {
    date: "2019-08-08",
    open: 125.11,
    high: 126.0,
    low: 121.09,
    close: 122.39
  },
  {
    date: "2019-08-09",
    open: 131.11,
    high: 133.0,
    low: 122.09,
    close: 124.39
  }
];

addMediana();

function addMediana() {
  for (var i = 0; i < data.length; i++) {
    var dataItem = data[i];
    dataItem.mediana =
      Number(dataItem.low) + (Number(dataItem.high) - Number(dataItem.low)) / 2;
  }
}

series.data.processor = am5.DataProcessor.new(root, {
  dateFields: ["date"],
  dateFormat: "yyyy-MM-dd"
});

series.data.setAll(data);
medianaSeries.data.setAll(data);

// Make stuff animate on load
// https://www.amcharts.com/docs/v5/concepts/animations/
series.appear(1000, 100);
medianaSeries.appear(1000, 100);
chart.appear(1000, 100);

}); // end am5.ready()
</script>

<!-- HTML -->
<div id="chartdiv"></div>