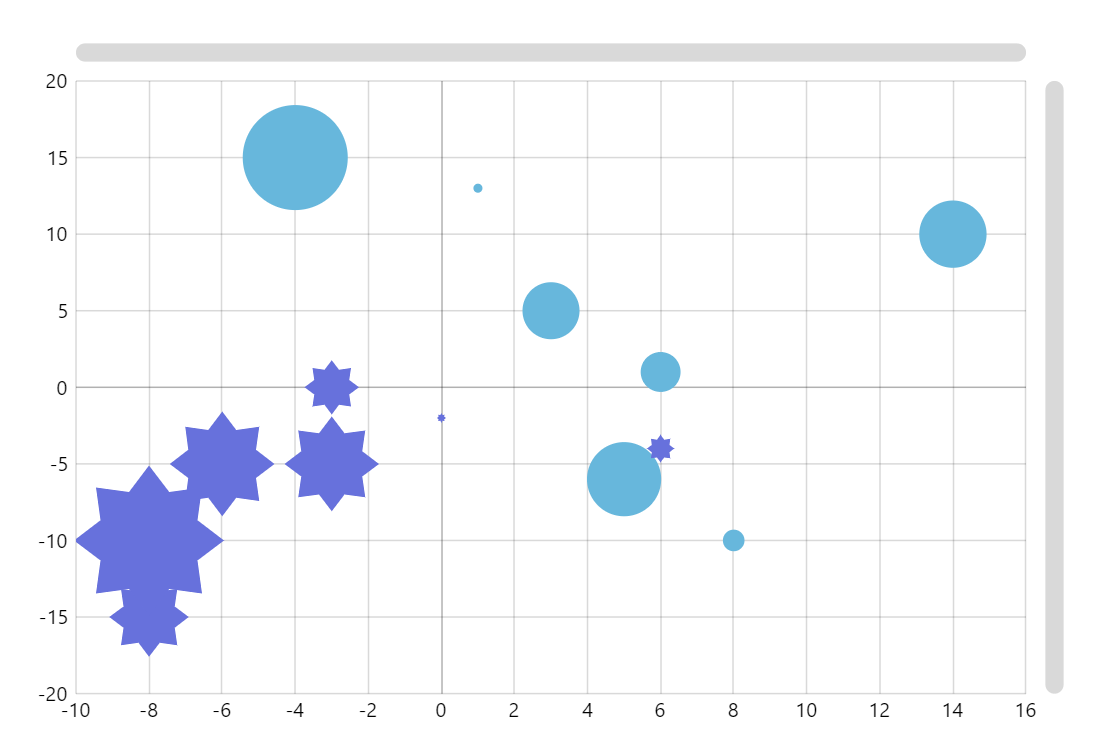
Bubble Chart
Bubble chart displays three dimensions of data: 2 dimensions are represented by the x,y position of the data point, and the third one is represented by its size.
Related tutorials
Demo source
<!-- Styles -->
<style>
#chartdiv {
  width: 100%;
  height: 500px;
}
</style>

<!-- Resources -->
<script src="https://cdn.amcharts.com/lib/5/index.js"></script>
<script src="https://cdn.amcharts.com/lib/5/xy.js"></script>
<script src="https://cdn.amcharts.com/lib/5/themes/Animated.js"></script>

<!-- Chart code -->
<script>
am5.ready(function() {

// Create root element
// https://www.amcharts.com/docs/v5/getting-started/#Root_element
var root = am5.Root.new("chartdiv");

// Set themes
// https://www.amcharts.com/docs/v5/concepts/themes/
root.setThemes([
  am5themes_Animated.new(root)
]);

// Create chart
// https://www.amcharts.com/docs/v5/charts/xy-chart/
var chart = root.container.children.push(am5xy.XYChart.new(root, {
  panX: true,
  panY: true,
  wheelY: "zoomXY",
  pinchZoomX:true,
  pinchZoomY:true
}));

chart.get("colors").set("step", 2);

// Create axes
// https://www.amcharts.com/docs/v5/charts/xy-chart/axes/
var xAxis = chart.xAxes.push(am5xy.ValueAxis.new(root, {
  renderer: am5xy.AxisRendererX.new(root, { minGridDistance: 50 }),
  tooltip: am5.Tooltip.new(root, {})
}));

var yAxis = chart.yAxes.push(am5xy.ValueAxis.new(root, {
  renderer: am5xy.AxisRendererY.new(root, {}),
  tooltip: am5.Tooltip.new(root, {})
}));

// Create series
// https://www.amcharts.com/docs/v5/charts/xy-chart/series/
var series0 = chart.series.push(am5xy.LineSeries.new(root, {
  calculateAggregates: true,
  xAxis: xAxis,
  yAxis: yAxis,
  valueYField: "y",
  valueXField: "x",
  valueField: "value",
  tooltip: am5.Tooltip.new(root, {
    labelText: "x: {valueX}, y: {valueY}, value: {value}"
  })
}));


// Add bullet
// https://www.amcharts.com/docs/v5/charts/xy-chart/series/#Bullets
var circleTemplate = am5.Template.new({});
series0.bullets.push(function() {
  var graphics = am5.Circle.new(root, {
    fill: series0.get("fill"),
  }, circleTemplate);
  return am5.Bullet.new(root, {
    sprite: graphics
  });
});

// Add heat rule
// https://www.amcharts.com/docs/v5/concepts/settings/heat-rules/
series0.set("heatRules", [{
  target: circleTemplate,
  min: 3,
  max: 35,
  dataField: "value",
  key: "radius"
}]);


// Create second series
// https://www.amcharts.com/docs/v5/charts/xy-chart/series/
var series1 = chart.series.push(am5xy.LineSeries.new(root, {
  calculateAggregates: true,
  xAxis: xAxis,
  yAxis: yAxis,
  valueYField: "y2",
  valueXField: "x2",
  valueField: "value",
  tooltip: am5.Tooltip.new(root, {
    labelText: "x: {valueX}, y: {valueY}, value: {value}"
  })
}));

// Add bullet
// https://www.amcharts.com/docs/v5/charts/xy-chart/series/#Bullets
var starTemplate = am5.Template.new({});
series1.bullets.push(function() {
  var graphics = am5.Star.new(root, {
    fill: series1.get("fill"),
    spikes: 8,
    innerRadius: am5.percent(70),
  }, starTemplate);
  return am5.Bullet.new(root, {
    sprite: graphics
  });
});


// Add heat rule
// https://www.amcharts.com/docs/v5/concepts/settings/heat-rules/
series1.set("heatRules", [{
  target: starTemplate,
  min: 3,
  max: 50,
  dataField: "value",
  key: "radius"
}]);


series0.strokes.template.set("strokeOpacity", 0);
series1.strokes.template.set("strokeOpacity", 0);

// Add cursor
// https://www.amcharts.com/docs/v5/charts/xy-chart/cursor/
chart.set("cursor", am5xy.XYCursor.new(root, {
  xAxis: xAxis,
  yAxis: yAxis,
  snapToSeries: [series0, series1]
}));

// Add scrollbars
// https://www.amcharts.com/docs/v5/charts/xy-chart/scrollbars/
chart.set("scrollbarX", am5.Scrollbar.new(root, {
  orientation: "horizontal"
}));

chart.set("scrollbarY", am5.Scrollbar.new(root, {
  orientation: "vertical"
}));


var data = [{
  "y": 10,
  "x": 14,
  "value": 59,
  "y2": -5,
  "x2": -3,
  "value2": 44
}, {
  "y": 5,
  "x": 3,
  "value": 50,
  "y2": -15,
  "x2": -8,
  "value2": 12
}, {
  "y": -10,
  "x": 8,
  "value": 19,
  "y2": -4,
  "x2": 6,
  "value2": 35
}, {
  "y": -6,
  "x": 5,
  "value": 65,
  "y2": -5,
  "x2": -6,
  "value2": 168
}, {
  "y": 15,
  "x": -4,
  "value": 92,
  "y2": -10,
  "x2": -8,
  "value2": 102
}, {
  "y": 13,
  "x": 1,
  "value": 8,
  "y2": -2,
  "x2": 0,
  "value2": 41
}, {
  "y": 1,
  "x": 6,
  "value": 35,
  "y2": 0,
  "x2": -3,
  "value2": 16
}]

series0.data.setAll(data);
series1.data.setAll(data);


// Make stuff animate on load
// https://www.amcharts.com/docs/v5/concepts/animations/
series0.appear(1000);
series1.appear(1000);

chart.appear(1000, 100);

}); // end am5.ready()
</script>

<!-- HTML -->
<div id="chartdiv"></div>