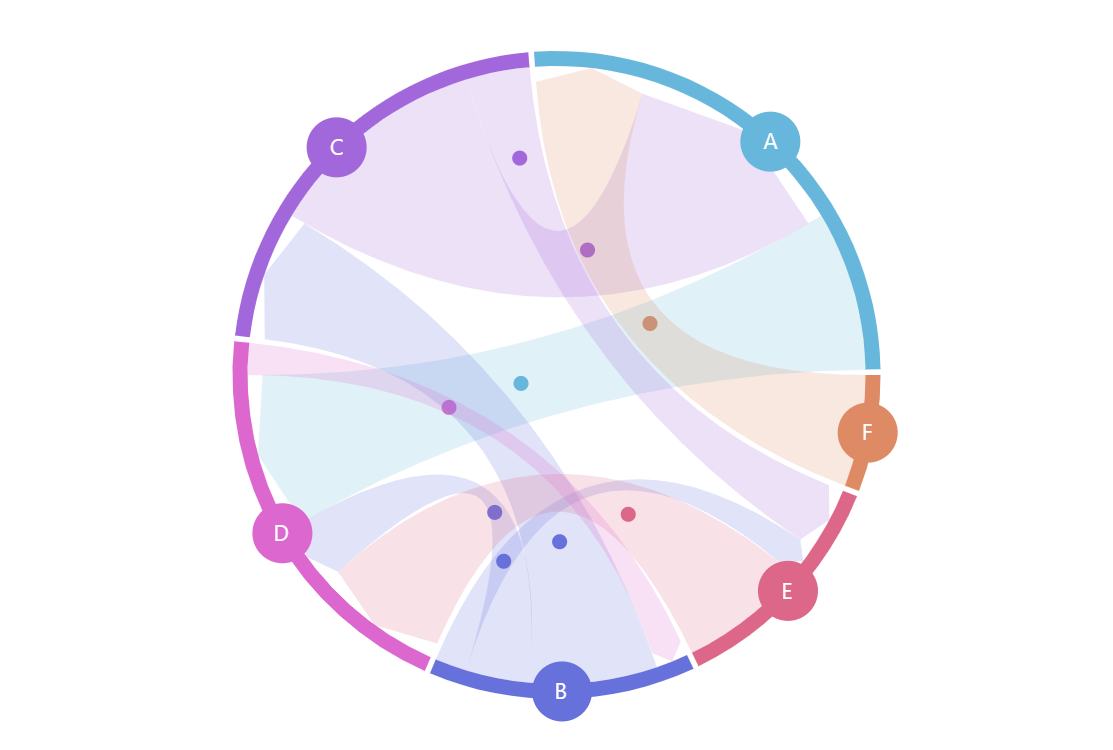
Chord Diagram with Animated Bullets
Animations help direct viewer’s attention and, in the case of the directed chord diagram, emphasize the direction of the data flow.
Key implementation details
Bullets have locationX and locationY properties which indicate relative position of the bullet within the target element (accepted values are between 0 and 1). So, all we need to do is add a bullet to each data item and animate its locationY value from 0 to 1 in a loop.
Related tutorials
Demo source
<!-- Styles -->
<style>
#chartdiv {
  width: 100%;
  height: 500px;
}
</style>

<!-- Resources -->
<script src="https://cdn.amcharts.com/lib/5/index.js"></script>
<script src="https://cdn.amcharts.com/lib/5/flow.js"></script>
<script src="https://cdn.amcharts.com/lib/5/themes/Animated.js"></script>

<!-- Chart code -->
<script>
am5.ready(function() {

// Create root element
// https://www.amcharts.com/docs/v5/getting-started/#Root_element
var root = am5.Root.new("chartdiv");

// Set themes
// https://www.amcharts.com/docs/v5/concepts/themes/
root.setThemes([am5themes_Animated.new(root)]);

// Create series
// https://www.amcharts.com/docs/v5/charts/flow-charts/
var series = root.container.children.push(
  am5flow.ChordDirected.new(root, {
    sourceIdField: "from",
    targetIdField: "to",
    valueField: "value",
    sort: "ascending"
  })
);

series.links.template.set("fillStyle", "source");

series.nodes.get("colors").set("step", 2);
series.nodes.data.setAll([
  { id: "A" },
  { id: "B" },
  { id: "C" },
  { id: "D" },
  { id: "E" },
  { id: "F" }
]);

series.nodes.get("colors").set("step", 2);

series.bullets.push(function (_root, _series, dataItem) {
  var bullet = am5.Bullet.new(root, {
    locationY: Math.random(),
    sprite: am5.Circle.new(root, {
      radius: 5,
      fill: dataItem.get("source").get("fill")
    })
  });

  bullet.animate({
    key: "locationY",
    to: 1,
    from: 0,
    duration: Math.random() * 1000 + 2000,
    loops: Infinity
  });

  return bullet;
});

series.nodes.labels.template.setAll({
  textType: "regular",
  fill: root.interfaceColors.get("background"),
  fontSize: "1.1em",
  radius: -5
});

series.nodes.bullets.push(function (_root, _series, dataItem) {
  return am5.Bullet.new(root, {
    sprite: am5.Circle.new(root, {
      radius: 20,
      fill: dataItem.get("fill")
    })
  });
});

series.children.moveValue(series.bulletsContainer, 0);

// Set data
// https://www.amcharts.com/docs/v5/charts/flow-charts/#Setting_data
series.data.setAll([
  { from: "A", to: "D", value: 10 },
  { from: "B", to: "C", value: 8 },
  { from: "B", to: "D", value: 4 },
  { from: "B", to: "E", value: 2 },
  { from: "C", to: "A", value: 14 },
  { from: "C", to: "E", value: 4 },
  { from: "E", to: "D", value: 8 },
  { from: "F", to: "A", value: 7 },
  { from: "D", to: "B", value: 2 }
]);

// Make stuff animate on load
series.appear(1000, 100);

}); // end am5.ready()
</script>

<!-- HTML -->
<div id="chartdiv"></div>