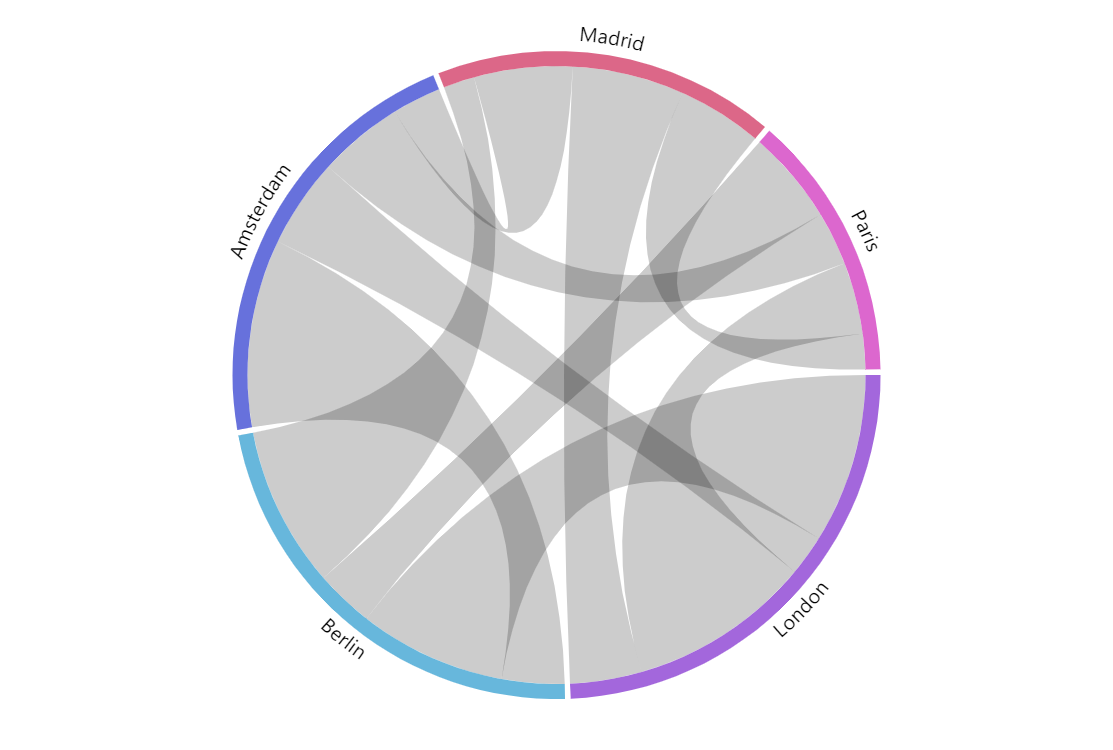
Chord Diagram
Chord Diagrams (also known as Radial network diagram, Chord layout, Dependency wheel) help us visualize relationships between data arranged beautifully in a circle. You can use Chord Diagrams to visualize data ranging from relationships between Lost characters to Uber rides between neighborhoods in a city to complex scientific subjects that are even hard to pronounce.
amCharts 5 includes powerful tools to create your own interactive Chord diagrams and other Flow charts.
Demo source
<!-- Styles -->
<style>
#chartdiv {
  width: 100%;
  height: 500px;
}
</style>

<!-- Resources -->
<script src="https://cdn.amcharts.com/lib/5/index.js"></script>
<script src="https://cdn.amcharts.com/lib/5/flow.js"></script>
<script src="https://cdn.amcharts.com/lib/5/themes/Animated.js"></script>

<!-- Chart code -->
<script>
am5.ready(function() {

// Create root element
// https://www.amcharts.com/docs/v5/getting-started/#Root_element
var root = am5.Root.new("chartdiv");


// Set themes
// https://www.amcharts.com/docs/v5/concepts/themes/
root.setThemes([
  am5themes_Animated.new(root)
]);


// Create series
// https://www.amcharts.com/docs/v5/charts/flow-charts/
var series = root.container.children.push(am5flow.Chord.new(root, {
  sourceIdField: "source",
  targetIdField: "target",
  valueField: "value"
}));
series.nodes.get("colors").set("step", 2);


// Set data
// https://www.amcharts.com/docs/v5/charts/flow-charts/#Setting_data
series.data.setAll([
  { source: "Berlin", target: "Amsterdam", value: 14 },
  { source: "Berlin", target: "London", value: 33 },
  { source: "Berlin", target: "Paris", value: 13 },
  { source: "Berlin", target: "Madrid", value: 36 },

  { source: "Amsterdam", target: "Berlin", value: 42 },
  { source: "Amsterdam", target: "London", value: 20 },
  { source: "Amsterdam", target: "Paris", value: 19 },
  { source: "Amsterdam", target: "Madrid", value: 11 },

  { source: "London", target: "Amsterdam", value: 9 },
  { source: "London", target: "Berlin", value: 38 },
  { source: "London", target: "Paris", value: 41 },
  { source: "London", target: "Madrid", value: 16 },

  { source: "Paris", target: "Amsterdam", value: 12 },
  { source: "Paris", target: "London", value: 16 },
  { source: "Paris", target: "Berlin", value: 21 },
  { source: "Paris", target: "Madrid", value: 8 },

  { source: "Madrid", target: "Amsterdam", value: 22 },
  { source: "Madrid", target: "London", value: 25 },
  { source: "Madrid", target: "Paris", value: 19 },
  { source: "Madrid", target: "Berlin", value: 7 }
]);


// Make stuff animate on load
series.appear(1000, 100);

}); // end am5.ready()
</script>

<!-- HTML -->
<div id="chartdiv"></div>