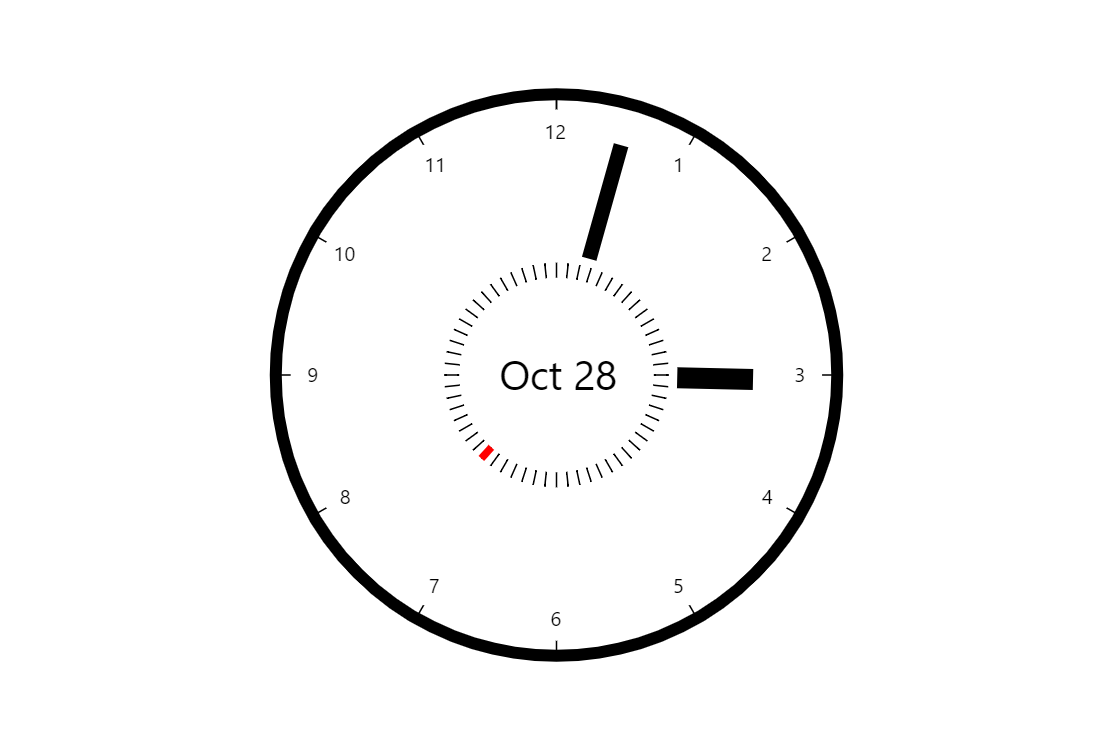
Clock with Two Faces
amCharts Radar Chart can be used for tasks beyond your common data visualization. In this case, we create a functioning clock with separate faces for hours/minutes and seconds.
Key implementation details
To get two clock faces with just add two circular value axes to the Radar chart. We then configure clock hands with the same radii as the respective axes.
Related tutorials
Demo source
<!-- Styles -->
<style>
#chartdiv {
  width: 100%;
  height: 500px;
}
</style>

<!-- Resources -->
<script src="https://cdn.amcharts.com/lib/5/index.js"></script>
<script src="https://cdn.amcharts.com/lib/5/xy.js"></script>
<script src="https://cdn.amcharts.com/lib/5/radar.js"></script>
<script src="https://cdn.amcharts.com/lib/5/themes/Animated.js"></script>

<!-- Chart code -->
<script>
am5.ready(function() {

// Create root element
// https://www.amcharts.com/docs/v5/getting-started/#Root_element
var root = am5.Root.new("chartdiv");


// Set themes
// https://www.amcharts.com/docs/v5/concepts/themes/
root.setThemes([
  am5themes_Animated.new(root)
]);


// Create chart
// https://www.amcharts.com/docs/v5/charts/radar-chart/
var chart = root.container.children.push(am5radar.RadarChart.new(root, {
  panX: false,
  panY: false
}));


// Create axis and its renderer
// https://www.amcharts.com/docs/v5/charts/radar-chart/gauge-charts/#Axes
var axisRenderer = am5radar.AxisRendererCircular.new(root, {
  innerRadius: -10,
  strokeOpacity: 1,
  strokeWidth: 8,
  minGridDistance: 10
});

var xAxis = chart.xAxes.push(am5xy.ValueAxis.new(root, {
  maxDeviation: 0,
  min: 0,
  max: 12,
  strictMinMax: true,
  renderer: axisRenderer,
  maxPrecision: 0
}));

// second axis
// https://www.amcharts.com/docs/v5/charts/radar-chart/gauge-charts/#Axes
var secondAxisRenderer = am5radar.AxisRendererCircular.new(root, {
  innerRadius: -10,
  radius: am5.percent(40),
  strokeOpacity: 0,
  minGridDistance: 1
});

var secondXAxis = chart.xAxes.push(am5xy.ValueAxis.new(root, {
  maxDeviation: 0,
  min: 0,
  max: 60,
  strictMinMax: true,
  renderer: secondAxisRenderer,
  maxPrecision: 0
}));


// hides 0 value
axisRenderer.labels.template.setAll({
  minPosition: 0.02,
  textType: "adjusted",
  inside: true,
  radius: 25
});
axisRenderer.grid.template.set("strokeOpacity", 1);


secondAxisRenderer.labels.template.setAll({
  forceHidden: true
});
secondAxisRenderer.grid.template.setAll({
  forceHidden: true
});
secondAxisRenderer.ticks.template.setAll({
  strokeOpacity: 1,
  minPosition: 0.01,
  visible: true,
  inside: true,
  length: 10
});

// Add clock hands
// https://www.amcharts.com/docs/v5/charts/radar-chart/gauge-charts/#Clock_hands

// hour
var hourDataItem = xAxis.makeDataItem({});

var hourHand = am5radar.ClockHand.new(root, {
  radius: am5.percent(70),
  topWidth: 14,
  bottomWidth: 14,
  innerRadius: am5.percent(43),
  pinRadius: 0,
  layer: 5
})

hourDataItem.set("bullet", am5xy.AxisBullet.new(root, {
  sprite: hourHand
}));

xAxis.createAxisRange(hourDataItem);

hourDataItem.get("grid").set("visible", false);

// minutes
var minutesDataItem = xAxis.makeDataItem({});

var minutesHand = am5radar.ClockHand.new(root, {
  radius: am5.percent(85),
  topWidth: 10,
  bottomWidth: 10,
  innerRadius: am5.percent(43),
  pinRadius: 0,
  layer: 5
})

minutesDataItem.set("bullet", am5xy.AxisBullet.new(root, {
  sprite: minutesHand
}));

xAxis.createAxisRange(minutesDataItem);

minutesDataItem.get("grid").set("visible", false);

// seconds
var secondsDataItem = xAxis.makeDataItem({});

var secondsHand = am5radar.ClockHand.new(root, {
  radius: am5.percent(40),
  innerRadius: -10,
  topWidth: 5,
  bottomWidth: 5,
  pinRadius: 0,
  layer: 5
})

secondsHand.hand.set("fill", am5.color(0xff0000));
secondsHand.pin.set("fill", am5.color(0xff0000));

secondsDataItem.set("bullet", am5xy.AxisBullet.new(root, {
  sprite: secondsHand
}));

xAxis.createAxisRange(secondsDataItem);

secondsDataItem.get("grid").set("visible", false);

// week label
var label = chart.radarContainer.children.push(am5.Label.new(root, {
  fontSize: "2em",
  centerX: am5.p50,
  centerY: am5.p50
}));


setInterval(function() {
  updateHands(300)
}, 1000);

function updateHands(duration) {
  // get current date
  var date = new Date();
  var hours = date.getHours();

  if(hours > 12){
    hours -= 12;
  }

  var minutes = date.getMinutes();
  var seconds = date.getSeconds();

  // set hours
  hourDataItem.set("value", hours + minutes / 60 + seconds / 60 / 60);
  // set minutes
  minutesDataItem.set("value", 12 * (minutes + seconds / 60) / 60);
  // set seconds
  var current = secondsDataItem.get("value");
  var value = 12 * date.getSeconds() / 60;
  // otherwise animation will go from 59 to 0 and the hand will move backwards
  if (value == 0) {
    value = 11.999;
  }
  // if it's more than 11.99, set it to 0
  if (current > 11.99) {
    current = 0;
  }
  secondsDataItem.animate({
    key: "value",
    from: current,
    to: value,
    duration: duration
  });

  label.set("text", chart.getDateFormatter().format(date, "MMM dd"))
}

updateHands(0);

// Make stuff animate on load
chart.appear(1000, 100);

// update on visibility
document.addEventListener("visibilitychange", function() {
  updateHands(0)
});

}); // end am5.ready()
</script>

<!-- HTML -->
<div id="chartdiv"></div>