Clock
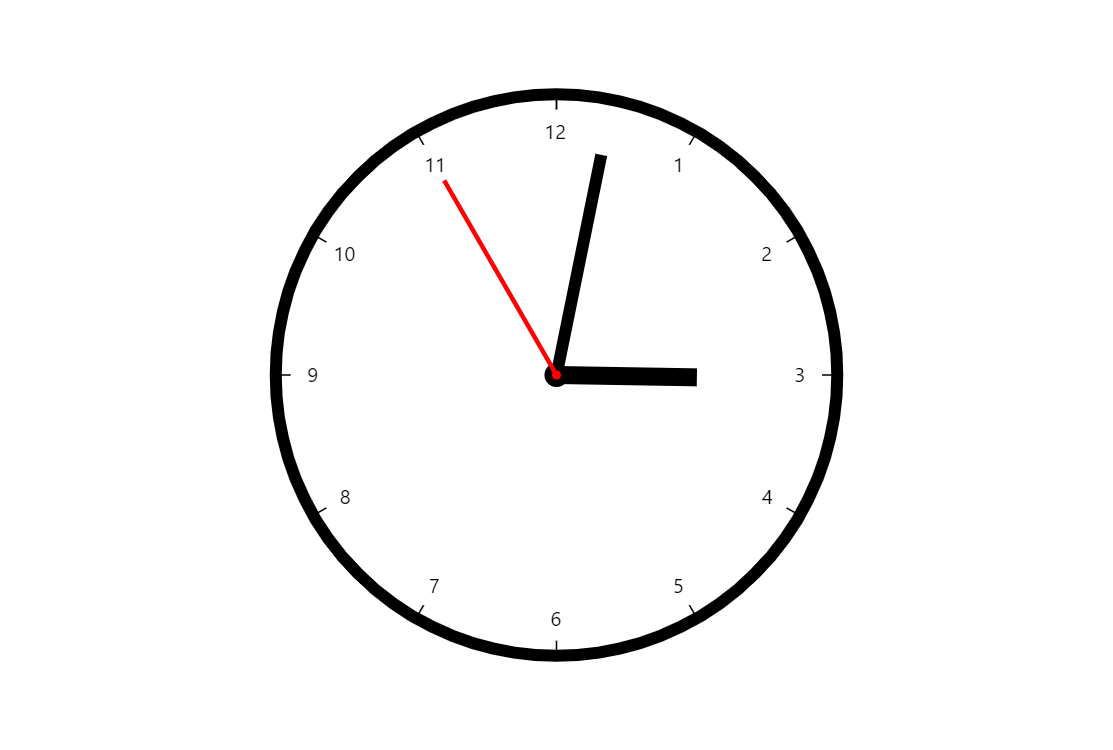
This demo showcases a creative use of the amCharts Gauge/Radar chart. amCharts core Charts package includes all the elements you need to create a functioning clock.
Key implementation details
We create a RadarChart, add and configure a circular ValueAxis, add clock hands for hours, minutes, and seconds and then just update the values every second.
Related tutorials
Demo source
<!-- Styles -->
<style>
#chartdiv {
  width: 100%;
  height: 500px;
}
</style>

<!-- Resources -->
<script src="https://cdn.amcharts.com/lib/5/index.js"></script>
<script src="https://cdn.amcharts.com/lib/5/xy.js"></script>
<script src="https://cdn.amcharts.com/lib/5/radar.js"></script>
<script src="https://cdn.amcharts.com/lib/5/themes/Animated.js"></script>

<!-- Chart code -->
<script>
am5.ready(function() {

// Create root element
// https://www.amcharts.com/docs/v5/getting-started/#Root_element
var root = am5.Root.new("chartdiv");


// Set themes
// https://www.amcharts.com/docs/v5/concepts/themes/
root.setThemes([
  am5themes_Animated.new(root)
]);


// Create chart
// https://www.amcharts.com/docs/v5/charts/radar-chart/
var chart = root.container.children.push(am5radar.RadarChart.new(root, {
  panX: false,
  panY: false
}));


// Create axis and its renderer
// https://www.amcharts.com/docs/v5/charts/radar-chart/gauge-charts/#Axes
var axisRenderer = am5radar.AxisRendererCircular.new(root, {
  innerRadius: -10,
  strokeOpacity: 1,
  strokeWidth: 8
});

var xAxis = chart.xAxes.push(am5xy.ValueAxis.new(root, {
  maxDeviation: 0,
  min: 0,
  max: 12,
  strictMinMax: true,
  renderer: axisRenderer,
  maxPrecision: 0
}));

// hides 0 value
axisRenderer.labels.template.setAll({
  minPosition: 0.02,
  textType: "adjusted",
  inside: true,
  radius: 25
});
axisRenderer.grid.template.set("strokeOpacity", 1);


// Add clock hands
// https://www.amcharts.com/docs/v5/charts/radar-chart/gauge-charts/#Clock_hands

// hour
var hourDataItem = xAxis.makeDataItem({});

var hourHand = am5radar.ClockHand.new(root, {
  radius: am5.percent(50),
  topWidth: 12,
  bottomWidth: 12,
  pinRadius: 8,
  layer:5
})

hourDataItem.set("bullet", am5xy.AxisBullet.new(root, {
  sprite: hourHand
}));

xAxis.createAxisRange(hourDataItem);

hourDataItem.get("grid").set("visible", false);

// minutes
var minutesDataItem = xAxis.makeDataItem({});

var minutesHand = am5radar.ClockHand.new(root, {
  radius: am5.percent(80),
  topWidth: 8,
  bottomWidth: 8,
  pinRadius: 7,
  layer:5
})

minutesDataItem.set("bullet", am5xy.AxisBullet.new(root, {
  sprite: minutesHand
}));

xAxis.createAxisRange(minutesDataItem);

minutesDataItem.get("grid").set("visible", false);

// seconds
var secondsDataItem = xAxis.makeDataItem({});

var secondsHand = am5radar.ClockHand.new(root, {
  radius: am5.percent(80),
  topWidth: 3,
  bottomWidth: 3,
  pinRadius: 3,
  layer:5
})

secondsHand.hand.set("fill", am5.color(0xff0000));
secondsHand.pin.set("fill", am5.color(0xff0000));

secondsDataItem.set("bullet", am5xy.AxisBullet.new(root, {
  sprite: secondsHand
}));

xAxis.createAxisRange(secondsDataItem);

secondsDataItem.get("grid").set("visible", false);


setInterval(function() {
  updateHands(300)
}, 1000);

function updateHands(duration) {
  // get current date
  var date = new Date();
  var hours = date.getHours();

  if(hours > 12){
    hours -= 12;
  }

  var minutes = date.getMinutes();
  var seconds = date.getSeconds();

  // set hours
  hourDataItem.set("value", hours + minutes / 60 + seconds / 60 / 60);
  // set minutes
  minutesDataItem.set("value", 12 * (minutes + seconds / 60) / 60);
  // set seconds
  var current = secondsDataItem.get("value");
  var value = 12 * date.getSeconds() / 60;
  // otherwise animation will go from 59 to 0 and the hand will move backwards
  if (value == 0) {
    value = 11.999;
  }
  // if it's more than 11.99, set it to 0
  if (current > 11.99) {
    current = 0;
  }
  secondsDataItem.animate({
    key: "value",
    from: current,
    to: value,
    duration: duration
  });
}

updateHands(0);

// Make stuff animate on load
chart.appear(1000, 100);

// update on visibility
document.addEventListener("visibilitychange", function() {
  updateHands(0)
});

}); // end am5.ready()
</script>

<!-- HTML -->
<div id="chartdiv"></div>