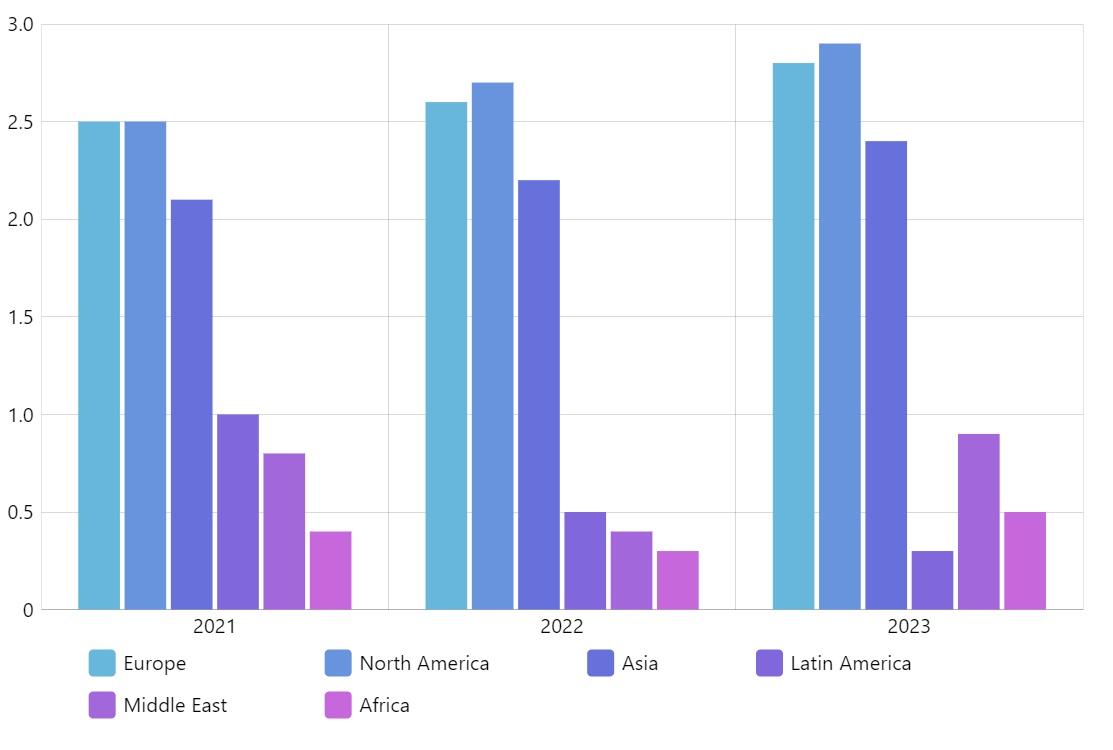
Clustered Column Chart
Clustered Column Chart is the default column chart behavior where values from all series are displayed next to each other at the same category axis value.
Key implementation details
In this demo we emphasize the “clusters” by adding margins around them. We do this by setting cellStartLocation and cellEndLocation on the horizontal axis renderer (AxisRendererX). We set them to 0.1 and 0.9 respectively, resulting in 10% margins on both sides.
Related tutorials
Demo source
<!-- Styles -->
<style>
#chartdiv {
  width: 100%;
  height: 500px;
}
</style>

<!-- Resources -->
<script src="https://cdn.amcharts.com/lib/5/index.js"></script>
<script src="https://cdn.amcharts.com/lib/5/xy.js"></script>
<script src="https://cdn.amcharts.com/lib/5/themes/Animated.js"></script>

<!-- Chart code -->
<script>
am5.ready(function() {


// Create root element
// https://www.amcharts.com/docs/v5/getting-started/#Root_element
var root = am5.Root.new("chartdiv");


// Set themes
// https://www.amcharts.com/docs/v5/concepts/themes/
root.setThemes([
  am5themes_Animated.new(root)
]);


// Create chart
// https://www.amcharts.com/docs/v5/charts/xy-chart/
var chart = root.container.children.push(am5xy.XYChart.new(root, {
  panX: false,
  panY: false,
  paddingLeft: 0,
  wheelX: "panX",
  wheelY: "zoomX",
  layout: root.verticalLayout
}));


// Add legend
// https://www.amcharts.com/docs/v5/charts/xy-chart/legend-xy-series/
var legend = chart.children.push(
  am5.Legend.new(root, {
    centerX: am5.p50,
    x: am5.p50
  })
);

var data = [{
  "year": "2021",
  "europe": 2.5,
  "namerica": 2.5,
  "asia": 2.1,
  "lamerica": 1,
  "meast": 0.8,
  "africa": 0.4
}, {
  "year": "2022",
  "europe": 2.6,
  "namerica": 2.7,
  "asia": 2.2,
  "lamerica": 0.5,
  "meast": 0.4,
  "africa": 0.3
}, {
  "year": "2023",
  "europe": 2.8,
  "namerica": 2.9,
  "asia": 2.4,
  "lamerica": 0.3,
  "meast": 0.9,
  "africa": 0.5
}]


// Create axes
// https://www.amcharts.com/docs/v5/charts/xy-chart/axes/
var xRenderer = am5xy.AxisRendererX.new(root, {
  cellStartLocation: 0.1,
  cellEndLocation: 0.9,
  minorGridEnabled: true
})

var xAxis = chart.xAxes.push(am5xy.CategoryAxis.new(root, {
  categoryField: "year",
  renderer: xRenderer,
  tooltip: am5.Tooltip.new(root, {})
}));

xRenderer.grid.template.setAll({
  location: 1
})

xAxis.data.setAll(data);

var yAxis = chart.yAxes.push(am5xy.ValueAxis.new(root, {
  renderer: am5xy.AxisRendererY.new(root, {
    strokeOpacity: 0.1
  })
}));


// Add series
// https://www.amcharts.com/docs/v5/charts/xy-chart/series/
function makeSeries(name, fieldName) {
  var series = chart.series.push(am5xy.ColumnSeries.new(root, {
    name: name,
    xAxis: xAxis,
    yAxis: yAxis,
    valueYField: fieldName,
    categoryXField: "year"
  }));

  series.columns.template.setAll({
    tooltipText: "{name}, {categoryX}:{valueY}",
    width: am5.percent(90),
    tooltipY: 0,
    strokeOpacity: 0
  });

  series.data.setAll(data);

  // Make stuff animate on load
  // https://www.amcharts.com/docs/v5/concepts/animations/
  series.appear();

  series.bullets.push(function () {
    return am5.Bullet.new(root, {
      locationY: 0,
      sprite: am5.Label.new(root, {
        text: "{valueY}",
        fill: root.interfaceColors.get("alternativeText"),
        centerY: 0,
        centerX: am5.p50,
        populateText: true
      })
    });
  });

  legend.data.push(series);
}

makeSeries("Europe", "europe");
makeSeries("North America", "namerica");
makeSeries("Asia", "asia");
makeSeries("Latin America", "lamerica");
makeSeries("Middle East", "meast");
makeSeries("Africa", "africa");


// Make stuff animate on load
// https://www.amcharts.com/docs/v5/concepts/animations/
chart.appear(1000, 100);

}); // end am5.ready()
</script>

<!-- HTML -->
<div id="chartdiv"></div>