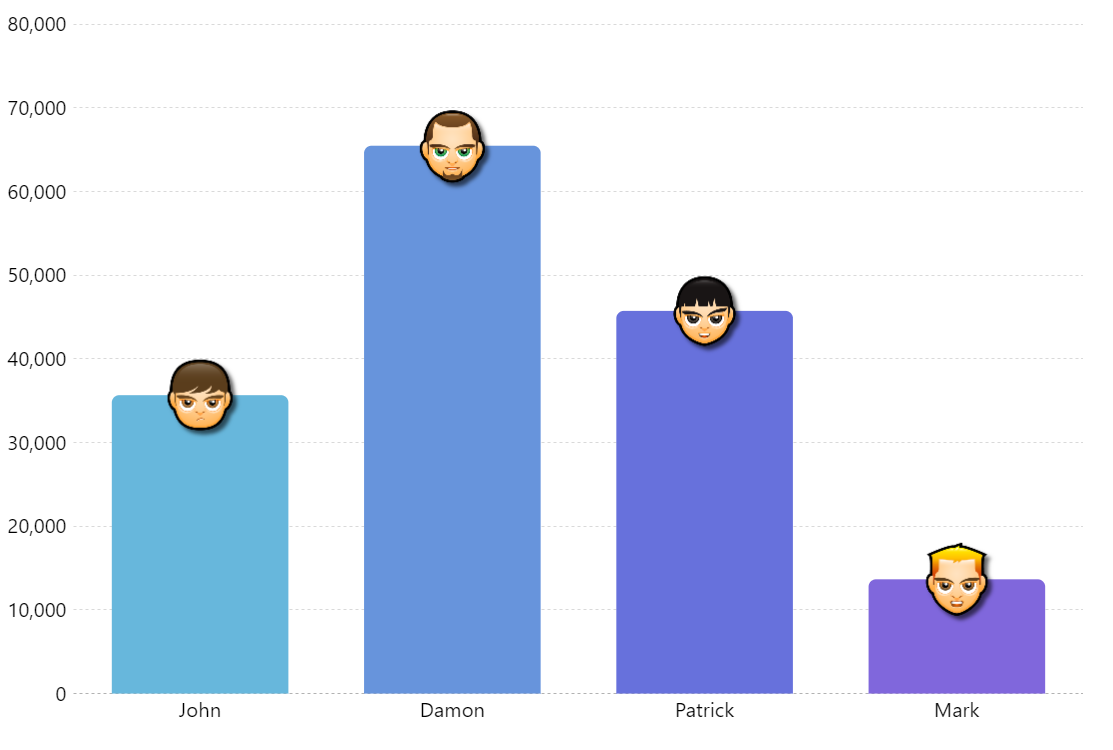
Column Chart with Images on Top
Bullets in amCharts 5 are more than just a way to display geometric shapes over the data points. You can display anything inside the bullet – from a simple circle to a fully fledged sub-chart. In this demo we display images as bullet content.
Key implementation details
We create bullets with their sprite field set to a Picture object. For the Picture we pull image URLs from the data by specifying its templateField. Data contains the src field setting for the image bullet.
Related tutorials
Demo source
<!-- Styles -->
<style>
#chartdiv {
  width: 100%;
  height: 500px;
}
</style>

<!-- Resources -->
<script src="https://cdn.amcharts.com/lib/5/index.js"></script>
<script src="https://cdn.amcharts.com/lib/5/xy.js"></script>
<script src="https://cdn.amcharts.com/lib/5/themes/Animated.js"></script>

<!-- Chart code -->
<script>
am5.ready(function() {

// Create root element
// https://www.amcharts.com/docs/v5/getting-started/#Root_element
var root = am5.Root.new("chartdiv");

// Set themes
// https://www.amcharts.com/docs/v5/concepts/themes/
root.setThemes([
  am5themes_Animated.new(root)
]);

// Create chart
// https://www.amcharts.com/docs/v5/charts/xy-chart/
var chart = root.container.children.push(am5xy.XYChart.new(root, {
  panX: false,
  panY: false,
  wheelX: "none",
  wheelY: "none",
  paddingLeft: 0
}));

// Add cursor
// https://www.amcharts.com/docs/v5/charts/xy-chart/cursor/
var cursor = chart.set("cursor", am5xy.XYCursor.new(root, {}));
cursor.lineY.set("visible", false);

// Create axes
// https://www.amcharts.com/docs/v5/charts/xy-chart/axes/
var xRenderer = am5xy.AxisRendererX.new(root, {
  minGridDistance: 30,
  minorGridEnabled: true
 });

var xAxis = chart.xAxes.push(am5xy.CategoryAxis.new(root, {
  maxDeviation: 0,
  categoryField: "name",
  renderer: xRenderer,
  tooltip: am5.Tooltip.new(root, {})
}));

xRenderer.grid.template.set("visible", false);

var yRenderer = am5xy.AxisRendererY.new(root, {});
var yAxis = chart.yAxes.push(am5xy.ValueAxis.new(root, {
  maxDeviation: 0,
  min: 0,
  extraMax: 0.1,
  renderer: yRenderer
}));

yRenderer.grid.template.setAll({
  strokeDasharray: [2, 2]
});

// Create series
// https://www.amcharts.com/docs/v5/charts/xy-chart/series/
var series = chart.series.push(am5xy.ColumnSeries.new(root, {
  name: "Series 1",
  xAxis: xAxis,
  yAxis: yAxis,
  valueYField: "value",
  sequencedInterpolation: true,
  categoryXField: "name",
  tooltip: am5.Tooltip.new(root, { dy: -25, labelText: "{valueY}" })
}));


series.columns.template.setAll({
  cornerRadiusTL: 5,
  cornerRadiusTR: 5,
  strokeOpacity: 0
});

series.columns.template.adapters.add("fill", (fill, target) => {
  return chart.get("colors").getIndex(series.columns.indexOf(target));
});

series.columns.template.adapters.add("stroke", (stroke, target) => {
  return chart.get("colors").getIndex(series.columns.indexOf(target));
});

// Set data
var data = [
  {
    name: "John",
    value: 35654,
    bulletSettings: { src: "https://www.amcharts.com/lib/images/faces/A04.png" }
  },
  {
    name: "Damon",
    value: 65456,
    bulletSettings: { src: "https://www.amcharts.com/lib/images/faces/C02.png" }
  },
  {
    name: "Patrick",
    value: 45724,
    bulletSettings: { src: "https://www.amcharts.com/lib/images/faces/D02.png" }
  },
  {
    name: "Mark",
    value: 13654,
    bulletSettings: { src: "https://www.amcharts.com/lib/images/faces/E01.png" }
  }
];

series.bullets.push(function() {
  return am5.Bullet.new(root, {
    locationY: 1,
    sprite: am5.Picture.new(root, {
      templateField: "bulletSettings",
      width: 50,
      height: 50,
      centerX: am5.p50,
      centerY: am5.p50,
      shadowColor: am5.color(0x000000),
      shadowBlur: 4,
      shadowOffsetX: 4,
      shadowOffsetY: 4,
      shadowOpacity: 0.6
    })
  });
});

xAxis.data.setAll(data);
series.data.setAll(data);

// Make stuff animate on load
// https://www.amcharts.com/docs/v5/concepts/animations/
series.appear(1000);
chart.appear(1000, 100);

}); // end am5.ready()
</script>

<!-- HTML -->
<div id="chartdiv"></div>