Columns with Moving Bullets
Interactivity is a great way to direct viewers attention in visualizations. amCharts 5 helps you implement moving bullets in a conservative but effective bar chart to make it way more appealing without sacrificing the maximum comprehension level of this classic chart type.
Key implementation details
We setup bullets by first creating a Container and adding a Circle to it for the border. Then we add another container for the image. To make an image round we create another circle and set it as a mask on the image container. Then we add our first container to a new Bullet and position it at the bottom of the parent element (locationY: 0).
On hover we animate the bullet to the top of the parent column (locationY: 1).
Related tutorials
Demo source
<!-- Styles -->
<style>
#chartdiv {
width: 100%;
height: 500px;
}
</style>
<!-- Resources -->
<script src="https://cdn.amcharts.com/lib/5/index.js"></script>
<script src="https://cdn.amcharts.com/lib/5/xy.js"></script>
<script src="https://cdn.amcharts.com/lib/5/themes/Animated.js"></script>
<!-- Chart code -->
<script>
am5.ready(function() {
// Create root element
// https://www.amcharts.com/docs/v5/getting-started/#Root_element
var root = am5.Root.new("chartdiv");
// Set themes
// https://www.amcharts.com/docs/v5/concepts/themes/
root.setThemes([
am5themes_Animated.new(root)
]);
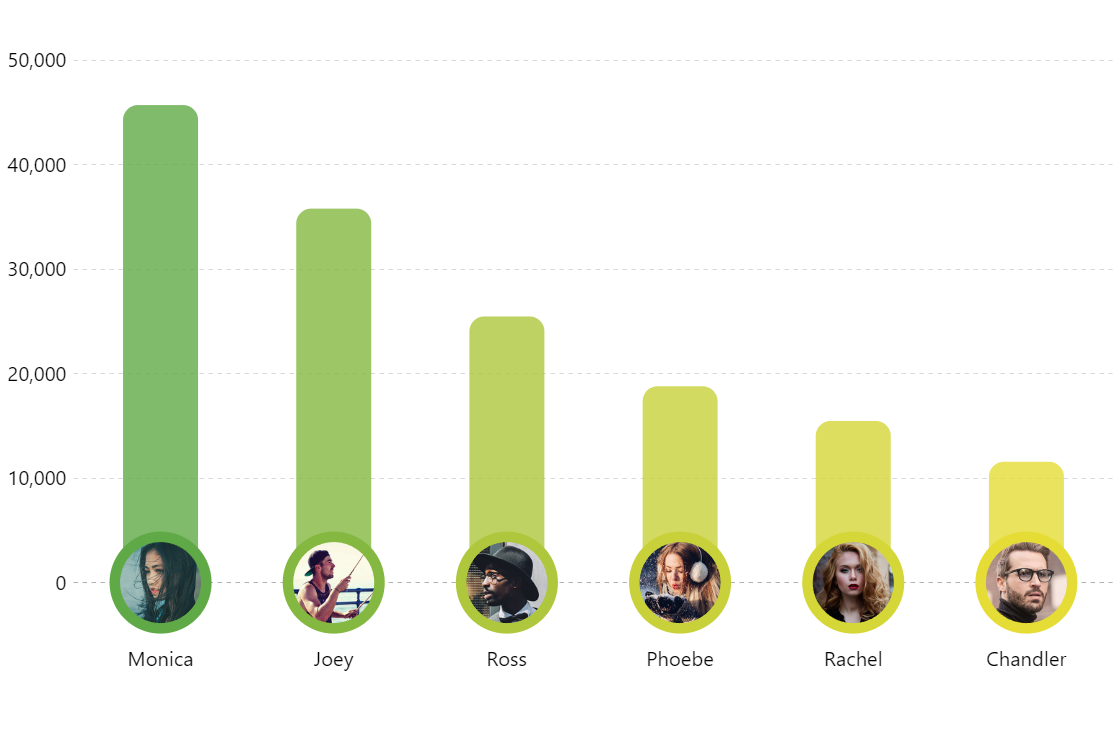
var data = [{
name: "Monica",
steps: 45688,
pictureSettings: {
src: "https://www.amcharts.com/wp-content/uploads/2019/04/monica.jpg"
}
}, {
name: "Joey",
steps: 35781,
pictureSettings: {
src: "https://www.amcharts.com/wp-content/uploads/2019/04/joey.jpg"
}
}, {
name: "Ross",
steps: 25464,
pictureSettings: {
src: "https://www.amcharts.com/wp-content/uploads/2019/04/ross.jpg"
}
}, {
name: "Phoebe",
steps: 18788,
pictureSettings: {
src: "https://www.amcharts.com/wp-content/uploads/2019/04/phoebe.jpg"
}
}, {
name: "Rachel",
steps: 15465,
pictureSettings: {
src: "https://www.amcharts.com/wp-content/uploads/2019/04/rachel.jpg"
}
}, {
name: "Chandler",
steps: 11561,
pictureSettings: {
src: "https://www.amcharts.com/wp-content/uploads/2019/04/chandler.jpg"
}
}];
// Create chart
// https://www.amcharts.com/docs/v5/charts/xy-chart/
var chart = root.container.children.push(
am5xy.XYChart.new(root, {
panX: false,
panY: false,
wheelX: "none",
wheelY: "none",
paddingBottom: 50,
paddingTop: 40,
paddingLeft:0,
paddingRight:0
})
);
// Create axes
// https://www.amcharts.com/docs/v5/charts/xy-chart/axes/
var xRenderer = am5xy.AxisRendererX.new(root, {
minorGridEnabled:true,
minGridDistance:60
});
xRenderer.grid.template.set("visible", false);
var xAxis = chart.xAxes.push(
am5xy.CategoryAxis.new(root, {
paddingTop:40,
categoryField: "name",
renderer: xRenderer
})
);
var yRenderer = am5xy.AxisRendererY.new(root, {});
yRenderer.grid.template.set("strokeDasharray", [3]);
var yAxis = chart.yAxes.push(
am5xy.ValueAxis.new(root, {
min: 0,
renderer: yRenderer
})
);
// Add series
// https://www.amcharts.com/docs/v5/charts/xy-chart/series/
var series = chart.series.push(
am5xy.ColumnSeries.new(root, {
name: "Income",
xAxis: xAxis,
yAxis: yAxis,
valueYField: "steps",
categoryXField: "name",
sequencedInterpolation: true,
calculateAggregates: true,
maskBullets: false,
tooltip: am5.Tooltip.new(root, {
dy: -30,
pointerOrientation: "vertical",
labelText: "{valueY}"
})
})
);
series.columns.template.setAll({
strokeOpacity: 0,
cornerRadiusBR: 10,
cornerRadiusTR: 10,
cornerRadiusBL: 10,
cornerRadiusTL: 10,
maxWidth: 50,
fillOpacity: 0.8
});
var currentlyHovered;
series.columns.template.events.on("pointerover", function (e) {
handleHover(e.target.dataItem);
});
series.columns.template.events.on("pointerout", function (e) {
handleOut();
});
function handleHover(dataItem) {
if (dataItem && currentlyHovered != dataItem) {
handleOut();
currentlyHovered = dataItem;
var bullet = dataItem.bullets[0];
bullet.animate({
key: "locationY",
to: 1,
duration: 600,
easing: am5.ease.out(am5.ease.cubic)
});
}
}
function handleOut() {
if (currentlyHovered) {
var bullet = currentlyHovered.bullets[0];
bullet.animate({
key: "locationY",
to: 0,
duration: 600,
easing: am5.ease.out(am5.ease.cubic)
});
}
}
var circleTemplate = am5.Template.new({});
series.bullets.push(function (root, series, dataItem) {
var bulletContainer = am5.Container.new(root, {});
var circle = bulletContainer.children.push(
am5.Circle.new(
root,
{
radius: 34
},
circleTemplate
)
);
var maskCircle = bulletContainer.children.push(
am5.Circle.new(root, { radius: 27 })
);
// only containers can be masked, so we add image to another container
var imageContainer = bulletContainer.children.push(
am5.Container.new(root, {
mask: maskCircle
})
);
var image = imageContainer.children.push(
am5.Picture.new(root, {
templateField: "pictureSettings",
centerX: am5.p50,
centerY: am5.p50,
width: 60,
height: 60
})
);
return am5.Bullet.new(root, {
locationY: 0,
sprite: bulletContainer
});
});
// heatrule
series.set("heatRules", [
{
dataField: "valueY",
min: am5.color(0xe5dc36),
max: am5.color(0x5faa46),
target: series.columns.template,
key: "fill"
},
{
dataField: "valueY",
min: am5.color(0xe5dc36),
max: am5.color(0x5faa46),
target: circleTemplate,
key: "fill"
}
]);
series.data.setAll(data);
xAxis.data.setAll(data);
var cursor = chart.set("cursor", am5xy.XYCursor.new(root, {}));
cursor.lineX.set("visible", false);
cursor.lineY.set("visible", false);
cursor.events.on("cursormoved", function () {
var dataItem = series.get("tooltip").dataItem;
if (dataItem) {
handleHover(dataItem);
} else {
handleOut();
}
});
// Make stuff animate on load
// https://www.amcharts.com/docs/v5/concepts/animations/
series.appear();
chart.appear(1000, 100);
}); // end am5.ready()
</script>
<!-- HTML -->
<div id="chartdiv"></div>