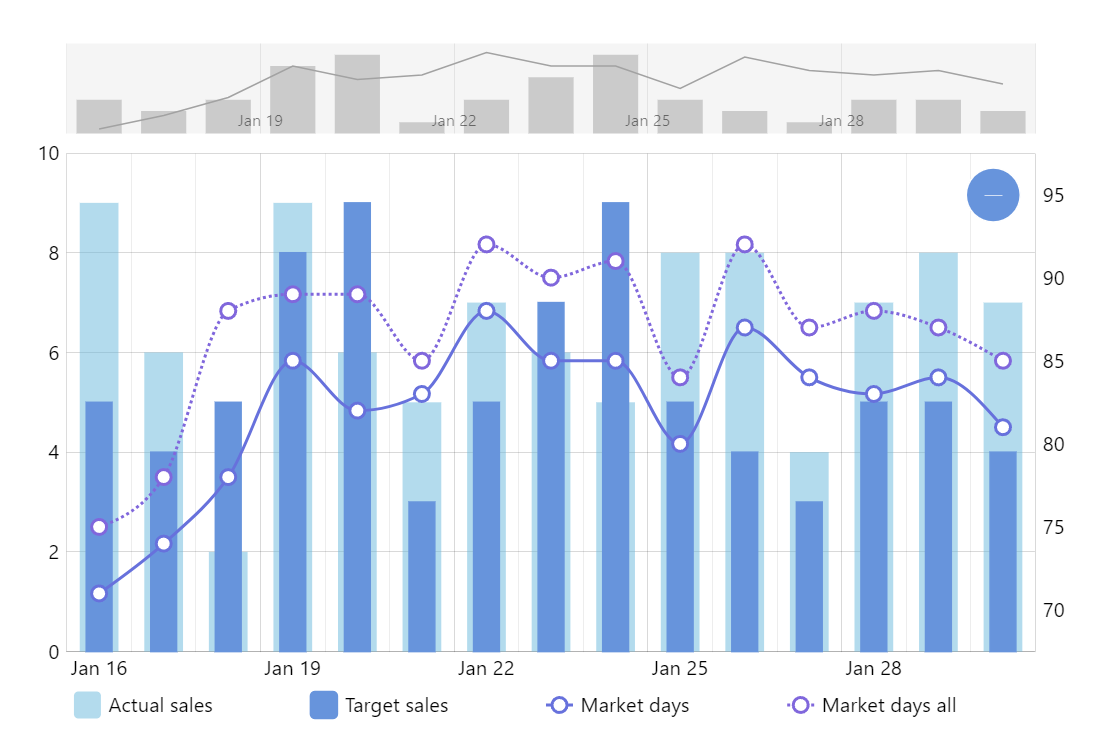
Combined Bullet/Column and Line Graphs with Multiple Value Axes
The XYChart is a universal chart type covering most of all of your two-dimensional charting needs. It can also have multiple value axes to represent dramatically different series in a nice readable chart. In this demo we plot two column series and two line series with two value axes.
Key implementation details
We create two value axes and position them on the opposite sides of the plot area. To do that we set opposite: true on the renderer of the second axis. When creating our column series we set there yAxis: yAxis0 (our first value axis) and on the line series we set the yAxis to yAxis1.
Related tutorials
Demo source
<!-- Styles -->
<style>
#chartdiv {
  width: 100%;
  height: 500px;
}
</style>

<!-- Resources -->
<script src="https://cdn.amcharts.com/lib/5/index.js"></script>
<script src="https://cdn.amcharts.com/lib/5/xy.js"></script>
<script src="https://cdn.amcharts.com/lib/5/themes/Animated.js"></script>

<!-- Chart code -->
<script>
am5.ready(function() {

// Data
var data = [
  {
    date: "2013-01-16",
    market0: 71,
    market1: 75,
    sales0: 5,
    sales1: 9
  },
  {
    date: "2013-01-17",
    market0: 74,
    market1: 78,
    sales0: 4,
    sales1: 6
  },
  {
    date: "2013-01-18",
    market0: 78,
    market1: 88,
    sales0: 5,
    sales1: 2
  },
  {
    date: "2013-01-19",
    market0: 85,
    market1: 89,
    sales0: 8,
    sales1: 9
  },
  {
    date: "2013-01-20",
    market0: 82,
    market1: 89,
    sales0: 9,
    sales1: 6
  },
  {
    date: "2013-01-21",
    market0: 83,
    market1: 85,
    sales0: 3,
    sales1: 5
  },
  {
    date: "2013-01-22",
    market0: 88,
    market1: 92,
    sales0: 5,
    sales1: 7
  },
  {
    date: "2013-01-23",
    market0: 85,
    market1: 90,
    sales0: 7,
    sales1: 6
  },
  {
    date: "2013-01-24",
    market0: 85,
    market1: 91,
    sales0: 9,
    sales1: 5
  },
  {
    date: "2013-01-25",
    market0: 80,
    market1: 84,
    sales0: 5,
    sales1: 8
  },
  {
    date: "2013-01-26",
    market0: 87,
    market1: 92,
    sales0: 4,
    sales1: 8
  },
  {
    date: "2013-01-27",
    market0: 84,
    market1: 87,
    sales0: 3,
    sales1: 4
  },
  {
    date: "2013-01-28",
    market0: 83,
    market1: 88,
    sales0: 5,
    sales1: 7
  },
  {
    date: "2013-01-29",
    market0: 84,
    market1: 87,
    sales0: 5,
    sales1: 8
  },
  {
    date: "2013-01-30",
    market0: 81,
    market1: 85,
    sales0: 4,
    sales1: 7
  }
];

// Create root element
// https://www.amcharts.com/docs/v5/getting-started/#Root_element
var root = am5.Root.new("chartdiv");

// Set themes
// https://www.amcharts.com/docs/v5/concepts/themes/
root.setThemes([
  am5themes_Animated.new(root)
]);

root.dateFormatter.setAll({
  dateFormat: "yyyy-MM-dd",
  dateFields: ["valueX"]
});

// Create chart
// https://www.amcharts.com/docs/v5/charts/xy-chart/
var chart = root.container.children.push(
  am5xy.XYChart.new(root, {
    panX: false,
    panY: false,
    wheelX: "panX",
    wheelY: "zoomX",
    layout: root.verticalLayout
  })
);

// Add cursor
// https://www.amcharts.com/docs/v5/charts/xy-chart/cursor/
var cursor = chart.set("cursor", am5xy.XYCursor.new(root, {
  behavior: "zoomX"
}));
cursor.lineY.set("visible", false);

// Create axes
// https://www.amcharts.com/docs/v5/charts/xy-chart/axes/
var xAxis = chart.xAxes.push(
  am5xy.DateAxis.new(root, {
    baseInterval: { timeUnit: "day", count: 1 },
    renderer: am5xy.AxisRendererX.new(root, {
      minorGridEnabled: true
    }),
    tooltip: am5.Tooltip.new(root, {}),
    tooltipDateFormat: "yyyy-MM-dd"
  })
);

var yAxis0 = chart.yAxes.push(
  am5xy.ValueAxis.new(root, {
    renderer: am5xy.AxisRendererY.new(root, {
      pan: "zoom"
    })
  })
);

var yRenderer1 = am5xy.AxisRendererY.new(root, {
  opposite: true
});
yRenderer1.grid.template.set("forceHidden", true);

var yAxis1 = chart.yAxes.push(
  am5xy.ValueAxis.new(root, {
    renderer: yRenderer1,
    syncWithAxis: yAxis0
  })
);

// Add series
// https://www.amcharts.com/docs/v5/charts/xy-chart/series/
var columnSeries1 = chart.series.push(
  am5xy.ColumnSeries.new(root, {
    name: "Actual sales",
    xAxis: xAxis,
    yAxis: yAxis0,
    valueYField: "sales1",
    valueXField: "date",
    clustered: false,
    tooltip: am5.Tooltip.new(root, {
      pointerOrientation: "horizontal",
      labelText: "{name}: {valueY}"
    })
  })
);

columnSeries1.columns.template.setAll({
  width: am5.percent(60),
  fillOpacity: 0.5,
  strokeOpacity: 0
});


columnSeries1.data.processor = am5.DataProcessor.new(root, {
  dateFields: ["date"],
  dateFormat: "yyyy-MM-dd"
});

var columnSeries0 = chart.series.push(
  am5xy.ColumnSeries.new(root, {
    name: "Target sales",
    xAxis: xAxis,
    yAxis: yAxis0,
    valueYField: "sales0",
    valueXField: "date",
    clustered: false,
    tooltip: am5.Tooltip.new(root, {
      pointerOrientation: "horizontal",
      labelText: "{name}: {valueY}"
    })
  })
);

columnSeries0.columns.template.set("width", am5.percent(40));

var series0 = chart.series.push(
  am5xy.SmoothedXLineSeries.new(root, {
    name: "Market days",
    xAxis: xAxis,
    yAxis: yAxis1,
    valueYField: "market0",
    valueXField: "date",
    tooltip: am5.Tooltip.new(root, {
      pointerOrientation: "horizontal",
      labelText: "{name}: {valueY}"
    })
  })
);

series0.strokes.template.setAll({
  strokeWidth: 2
});

// Add bullet
// https://www.amcharts.com/docs/v5/charts/xy-chart/series/#Bullets
series0.bullets.push(function () {
  return am5.Bullet.new(root, {
    sprite: am5.Circle.new(root, {
      stroke: series0.get("fill"),
      strokeWidth: 2,
      fill: root.interfaceColors.get("background"),
      radius: 5
    })
  });
});

var series1 = chart.series.push(
  am5xy.SmoothedXLineSeries.new(root, {
    name: "Market days all",
    xAxis: xAxis,
    yAxis: yAxis1,
    valueYField: "market1",
    valueXField: "date"
  })
);

series1.strokes.template.setAll({
  strokeWidth: 2,
  strokeDasharray: [2, 2]
});

var tooltip1 = series1.set("tooltip", am5.Tooltip.new(root, {
  pointerOrientation: "horizontal"
}));
tooltip1.label.set("text", "{name}: {valueY}");

// Add bullet
// https://www.amcharts.com/docs/v5/charts/xy-chart/series/#Bullets
series1.bullets.push(function () {
  return am5.Bullet.new(root, {
    sprite: am5.Circle.new(root, {
      stroke: series1.get("fill"),
      strokeWidth: 2,
      fill: root.interfaceColors.get("background"),
      radius: 5
    })
  });
});

// Add scrollbar
// https://www.amcharts.com/docs/v5/charts/xy-chart/scrollbars/
var scrollbar = chart.set("scrollbarX", am5xy.XYChartScrollbar.new(root, {
  orientation: "horizontal",
  height: 60
}));

var sbDateAxis = scrollbar.chart.xAxes.push(
  am5xy.DateAxis.new(root, {
    baseInterval: {
      timeUnit: "day",
      count: 1
    },
    renderer: am5xy.AxisRendererX.new(root, {})
  })
);

var sbValueAxis0 = scrollbar.chart.yAxes.push(
  am5xy.ValueAxis.new(root, {
    renderer: am5xy.AxisRendererY.new(root, {})
  })
);

var sbValueAxis1 = scrollbar.chart.yAxes.push(
  am5xy.ValueAxis.new(root, {
    renderer: am5xy.AxisRendererY.new(root, {})
  })
);

var sbSeries0 = scrollbar.chart.series.push(
  am5xy.ColumnSeries.new(root, {
    valueYField: "sales0",
    valueXField: "date",
    xAxis: sbDateAxis,
    yAxis: sbValueAxis0
  })
);

sbSeries0.columns.template.setAll({ fillOpacity: 0.5, strokeOpacity: 0 });

var sbSeries1 = scrollbar.chart.series.push(
  am5xy.LineSeries.new(root, {
    valueYField: "market0",
    valueXField: "date",
    xAxis: sbDateAxis,
    yAxis: sbValueAxis1
  })
);

var legend = chart.children.push(
  am5.Legend.new(root, {
    x: am5.p50,
    centerX: am5.p50
  })
);
legend.data.setAll(chart.series.values);

columnSeries1.data.setAll(data);
columnSeries0.data.setAll(data);

series0.data.setAll(data);
series1.data.setAll(data);

sbSeries0.data.setAll(data);
sbSeries1.data.setAll(data);

// Make stuff animate on load
// https://www.amcharts.com/docs/v5/concepts/animations/
series0.appear(1000);
series1.appear(1000);
chart.appear(1000, 100);

}); // end am5.ready()
</script>

<!-- HTML -->
<div id="chartdiv"></div>