Comparing Different Date Values Google Analytics Style
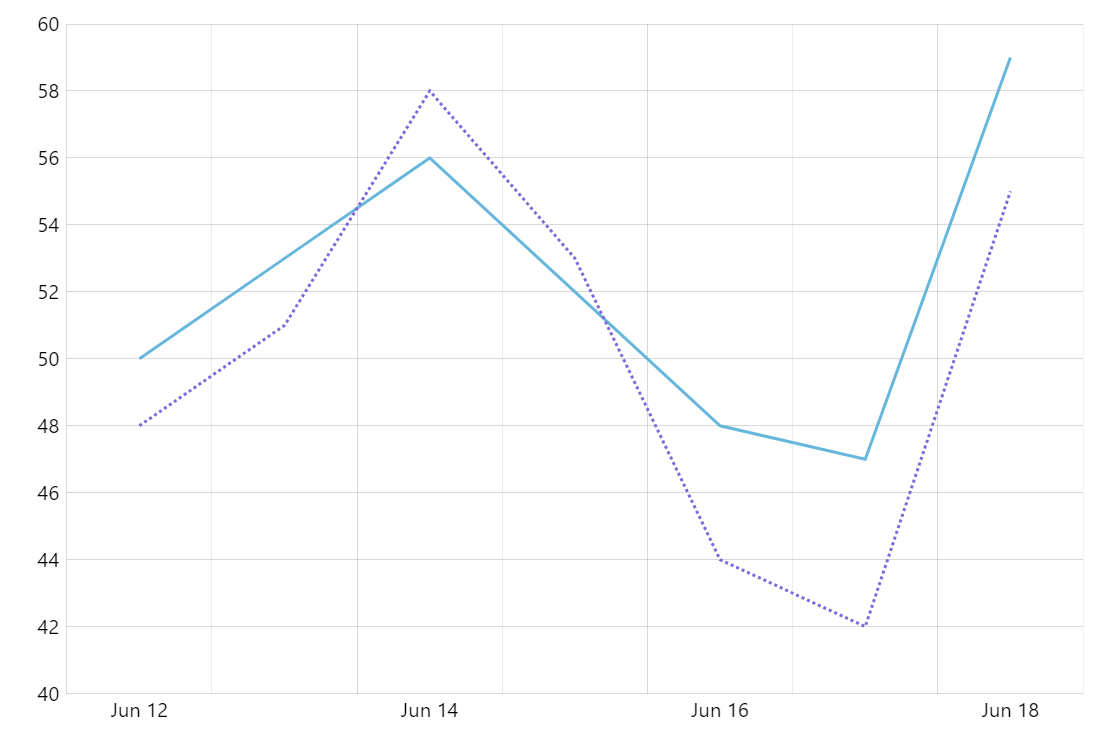
Google popularized this type of chart where data from one period is compared to the same data in the previous period in it’s Analytics product. In this demo we implement this concept with amCharts.
Key implementation details
We combine data for the current and previous period in one dataset. We use the current values for the first (solid) line series and the older values for the second (dotted) graph. One trick here is that we use both current and previous period dates and values for the tooltip on the first series to show both values in one place for easy comparison.
Related tutorials
Demo source
<!-- Styles -->
<style>
#chartdiv {
  width: 100%;
  height: 500px;
}
</style>

<!-- Resources -->
<script src="https://cdn.amcharts.com/lib/5/index.js"></script>
<script src="https://cdn.amcharts.com/lib/5/xy.js"></script>
<script src="https://cdn.amcharts.com/lib/5/themes/Animated.js"></script>

<!-- Chart code -->
<script>
am5.ready(function() {

// Create root element
// https://www.amcharts.com/docs/v5/getting-started/#Root_element
var root = am5.Root.new("chartdiv");


// Set themes
// https://www.amcharts.com/docs/v5/concepts/themes/
root.setThemes([
  am5themes_Animated.new(root)
]);


// Create chart
// https://www.amcharts.com/docs/v5/charts/xy-chart/
var chart = root.container.children.push(am5xy.XYChart.new(root, {
  panX: true,
  panY: true,
  wheelX: "panX",
  wheelY: "zoomX",
  pinchZoomX:true
}));

chart.get("colors").set("step", 3);


// Add cursor
// https://www.amcharts.com/docs/v5/charts/xy-chart/cursor/
var cursor = chart.set("cursor", am5xy.XYCursor.new(root, {}));
cursor.lineY.set("visible", false);


// Create axes
// https://www.amcharts.com/docs/v5/charts/xy-chart/axes/
var xAxis = chart.xAxes.push(am5xy.DateAxis.new(root, {
  maxDeviation: 0.3,
  baseInterval: {
    timeUnit: "day",
    count: 1
  },
  renderer: am5xy.AxisRendererX.new(root, { minorGridEnabled: true }),
  tooltip: am5.Tooltip.new(root, {})
}));

var yAxis = chart.yAxes.push(am5xy.ValueAxis.new(root, {
  maxDeviation: 0.3,
  renderer: am5xy.AxisRendererY.new(root, {})
}));


// Add series
// https://www.amcharts.com/docs/v5/charts/xy-chart/series/
var series = chart.series.push(am5xy.LineSeries.new(root, {
  name: "Series 1",
  xAxis: xAxis,
  yAxis: yAxis,
  valueYField: "value1",
  valueXField: "date",
  tooltip: am5.Tooltip.new(root, {
    labelText: "{valueX}: {valueY}\n{previousDate}: {value2}"
  })
}));

series.strokes.template.setAll({
  strokeWidth: 2
});

series.get("tooltip").get("background").set("fillOpacity", 0.5);

var series2 = chart.series.push(am5xy.LineSeries.new(root, {
  name: "Series 2",
  xAxis: xAxis,
  yAxis: yAxis,
  valueYField: "value2",
  valueXField: "date"
}));
series2.strokes.template.setAll({
  strokeDasharray: [2, 2],
  strokeWidth: 2
});

// Set date fields
// https://www.amcharts.com/docs/v5/concepts/data/#Parsing_dates
root.dateFormatter.setAll({
  dateFormat: "yyyy-MM-dd",
  dateFields: ["valueX"]
});


// Set data
var data = [{
  date: new Date(2019, 5, 12).getTime(),
  value1: 50,
  value2: 48,
  previousDate: new Date(2019, 5, 5)
}, {
  date: new Date(2019, 5, 13).getTime(),
  value1: 53,
  value2: 51,
  previousDate: "2019-05-06"
}, {
  date: new Date(2019, 5, 14).getTime(),
  value1: 56,
  value2: 58,
  previousDate: "2019-05-07"
}, {
  date: new Date(2019, 5, 15).getTime(),
  value1: 52,
  value2: 53,
  previousDate: "2019-05-08"
}, {
  date: new Date(2019, 5, 16).getTime(),
  value1: 48,
  value2: 44,
  previousDate: "2019-05-09"
}, {
  date: new Date(2019, 5, 17).getTime(),
  value1: 47,
  value2: 42,
  previousDate: "2019-05-10"
}, {
  date: new Date(2019, 5, 18).getTime(),
  value1: 59,
  value2: 55,
  previousDate: "2019-05-11"
}]

series.data.setAll(data);
series2.data.setAll(data);


// Make stuff animate on load
// https://www.amcharts.com/docs/v5/concepts/animations/
series.appear(1000);
series2.appear(1000);
chart.appear(1000, 100);

}); // end am5.ready()
</script>

<!-- HTML -->
<div id="chartdiv"></div>