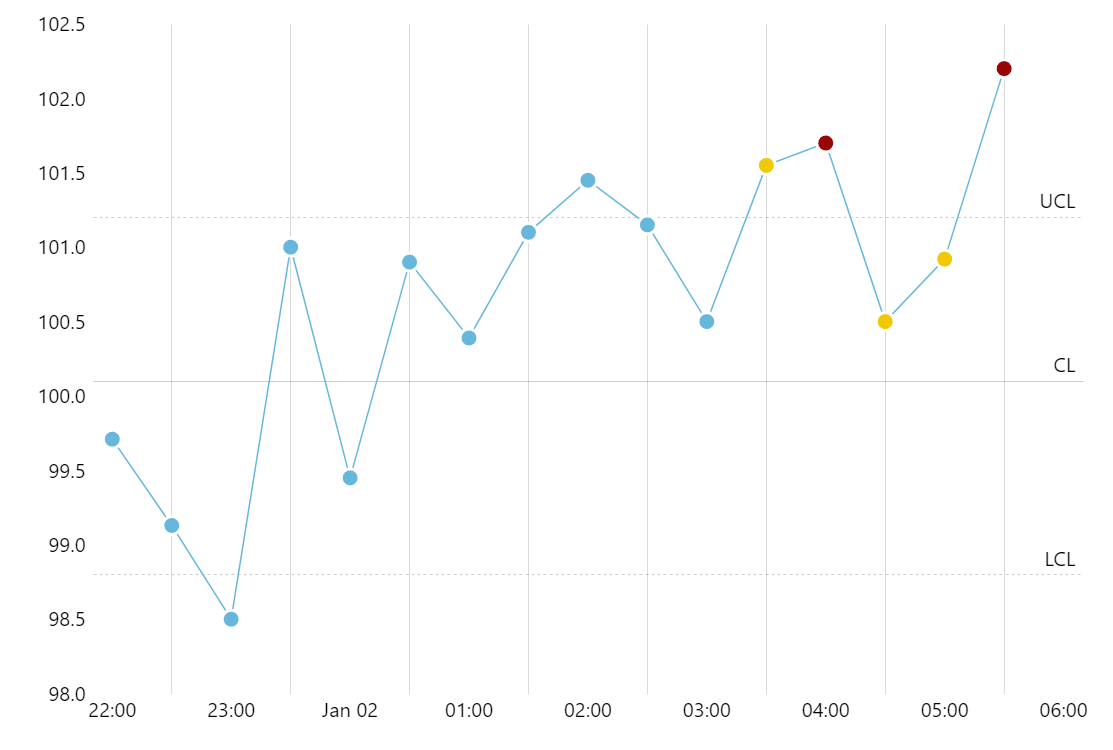
Control Chart
This demo shows how XYChart can be used to create a Control Chart (also known as Shewhart chart).
Key implementation details
We implement central line (CL) and upper and lower control limits using the axis range feature of amCharts XY Chart. Bullet color is set based on the data item.
Related tutorials
Demo source
<!-- Styles -->
<style>
#chartdiv {
  width: 100%;
  height: 500px;
}
</style>

<!-- Resources -->
<script src="https://cdn.amcharts.com/lib/5/index.js"></script>
<script src="https://cdn.amcharts.com/lib/5/xy.js"></script>
<script src="https://cdn.amcharts.com/lib/5/themes/Animated.js"></script>

<!-- Chart code -->
<script>
am5.ready(function() {


// Create root element
// https://www.amcharts.com/docs/v5/getting-started/#Root_element
var root = am5.Root.new("chartdiv");

// Set themes
// https://www.amcharts.com/docs/v5/concepts/themes/
root.setThemes([
  am5themes_Animated.new(root)
]);

// Create chart
// https://www.amcharts.com/docs/v5/charts/xy-chart/
var chart = root.container.children.push(am5xy.XYChart.new(root, {
  panX: true,
  panY: true,
  wheelX: "panX",
  wheelY: "zoomX",
  pinchZoomX: true
}));

// Create axes
// https://www.amcharts.com/docs/v5/charts/xy-chart/axes/
var xRenderer = am5xy.AxisRendererX.new(root, {
  minGridDistance: 60,
  minorGridEnabled: true
});

var xAxis = chart.xAxes.push(am5xy.DateAxis.new(root, {
  baseInterval: { timeUnit: "minute", count: 30 },
  renderer: xRenderer,
  tooltip: am5.Tooltip.new(root, {}),
  extraMin: 0.01,
  extraMax: 0.01,
  tooltipLocation: 0
}));

var yRenderer = am5xy.AxisRendererY.new(root, {});
yRenderer.grid.template.set("forceHidden", true);

var yAxis = chart.yAxes.push(am5xy.ValueAxis.new(root, {
  renderer: yRenderer
}));

// Add cursor
// https://www.amcharts.com/docs/v5/charts/xy-chart/cursor/
var cursor = chart.set("cursor", am5xy.XYCursor.new(root, {
  behavior: "none",
  xAxis: xAxis
}));
cursor.lineY.set("visible", false);

// Add series
// https://www.amcharts.com/docs/v5/charts/xy-chart/series/
var series = chart.series.push(am5xy.LineSeries.new(root, {
  name: "Series",
  xAxis: xAxis,
  yAxis: yAxis,
  valueYField: "value",
  valueXField: "timestamp",
  locationX: 0,
  seriesTooltipTarget: "bullet",
  tooltip: am5.Tooltip.new(root, {
    labelText: "{valueY}"
  })
}));

series.bullets.push(function () {
  var circleTemplate = am5.Template.new({
    radius: 6,
    templateField: "bulletSettings",
    fill: series.get("fill"),
    strokeWidth: 2,
    stroke: root.interfaceColors.get("background")
  })

  var circle = am5.Circle.new(root, {}, circleTemplate);

  return am5.Bullet.new(root, {
    sprite: circle,
    locationX: 0
  });
});

function createGuide(value, text, dashArray) {
  var guideDataItem = yAxis.makeDataItem({ value: value });
  yAxis.createAxisRange(guideDataItem);
  guideDataItem.get("grid").setAll({
    forceHidden: false,
    strokeOpacity: 0.2,
    strokeDasharray: dashArray
  });

  var label = guideDataItem.get("label");
  label.setAll({
    text: text,
    isMeasured: false,
    centerY: am5.p100
  });

  label.adapters.add("x", function (x) {
    return chart.plotContainer.width();
  })

  chart.events.on("boundschanged", function () {
    label.set("x", label.get("x"))
  })
}


createGuide(98.8, "LCL", [2, 2]);
createGuide(100.1, "CL");
createGuide(101.2, "UCL", [2, 2]);


var data = [{
  "timestamp": new Date(2020, 0, 1, 22, 30).getTime(),
  "value": 99.71
}, {
  "timestamp": new Date(2020, 0, 1, 23, 0).getTime(),
  "value": 99.13
}, {
  "timestamp": new Date(2020, 0, 1, 23, 30).getTime(),
  "value": 98.5
}, {
  "timestamp": new Date(2020, 0, 2, 0, 0).getTime(),
  "value": 101
}, {
  "timestamp": new Date(2020, 0, 2, 0, 30).getTime(),
  "value": 99.45
}, {
  "timestamp": new Date(2020, 0, 2, 1, 0).getTime(),
  "value": 100.9
}, {
  "timestamp": new Date(2020, 0, 2, 1, 30).getTime(),
  "value": 100.39
}, {
  "timestamp": new Date(2020, 0, 2, 2, 0).getTime(),
  "value": 101.1
}, {
  "timestamp": new Date(2020, 0, 2, 2, 30).getTime(),
  "value": 101.45
}, {
  "timestamp": new Date(2020, 0, 2, 3, 0).getTime(),
  "value": 101.15
}, {
  "timestamp": new Date(2020, 0, 2, 3, 30).getTime(),
  "value": 100.5
}, {
  "timestamp": new Date(2020, 0, 2, 4, 0).getTime(),
  "value": 101.55,
  "bulletSettings": { fill: am5.color("#f0c803") }
}, {
  "timestamp": new Date(2020, 0, 2, 4, 30).getTime(),
  "value": 101.7,
  "bulletSettings": { fill: am5.color("#970505") }
}, {
  "timestamp": new Date(2020, 0, 2, 5, 0).getTime(),
  "value": 100.5,
  "bulletSettings": { fill: am5.color("#f0c803") }
}, {
  "timestamp": new Date(2020, 0, 2, 5, 30).getTime(),
  "value": 100.92,
  "bulletSettings": { fill: am5.color("#f0c803") }
}, {
  "timestamp": new Date(2020, 0, 2, 6, 0).getTime(),
  "value": 102.2,
  "bulletSettings": { fill: am5.color("#970505") }
}];

series.data.setAll(data);

// Make stuff animate on load
// https://www.amcharts.com/docs/v5/concepts/animations/
series.appear(1000);
chart.appear(1000, 100);

}); // end am5.ready()
</script>

<!-- HTML -->
<div id="chartdiv"></div>