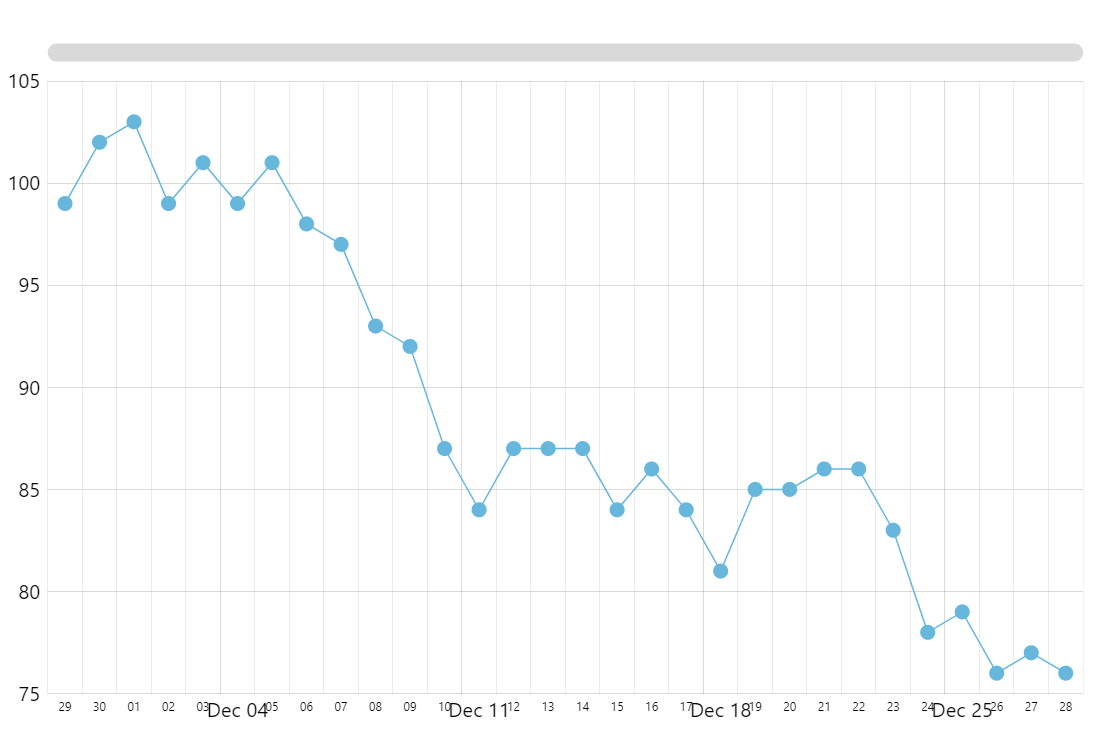
Date axis with labels near minor grid lines
Using minor grid lines enables decluttering the plot container, while still maintaining clear perception of axis scale as well as its relation to the series.
To enable labels near minor grid lines, just need to set minorLabelsEnabled: true for your axis renderer.
In this demo, we have increased minGridDistance to 200 in order for the minor labels to have enough space.
Also, we set minorDateFormats for axis as we need these labels to take as little space as possible, as we only need the day only.
The position of labels is further tweaked using custom theme.
Related documentation:
Demo source
<!-- Styles -->
<style>
#chartdiv {
  width: 100%;
  height: 500px;
}
</style>

<!-- Resources -->
<script src="https://cdn.amcharts.com/lib/5/index.js"></script>
<script src="https://cdn.amcharts.com/lib/5/xy.js"></script>
<script src="https://cdn.amcharts.com/lib/5/themes/Animated.js"></script>

<!-- Chart code -->
<script>
am5.ready(function() {

// Create root element
// https://www.amcharts.com/docs/v5/getting-started/#Root_element
var root = am5.Root.new("chartdiv");

const myTheme = am5.Theme.new(root);

// Move minor label a bit down
myTheme.rule("AxisLabel", ["minor"]).setAll({
  dy: 1
});

// Tweak minor grid opacity
myTheme.rule("Grid", ["minor"]).setAll({
  strokeOpacity: 0.08
});

// Set themes
// https://www.amcharts.com/docs/v5/concepts/themes/
root.setThemes([
  am5themes_Animated.new(root),
  myTheme
]);


// Create chart
// https://www.amcharts.com/docs/v5/charts/xy-chart/
var chart = root.container.children.push(am5xy.XYChart.new(root, {
  panX: false,
  panY: false,
  wheelX: "panX",
  wheelY: "zoomX",
  paddingLeft: 0
}));


// Add cursor
// https://www.amcharts.com/docs/v5/charts/xy-chart/cursor/
var cursor = chart.set("cursor", am5xy.XYCursor.new(root, {
  behavior: "zoomX"
}));
cursor.lineY.set("visible", false);

var date = new Date();
date.setHours(0, 0, 0, 0);
var value = 100;

function generateData() {
  value = Math.round((Math.random() * 10 - 5) + value);
  am5.time.add(date, "day", 1);
  return {
    date: date.getTime(),
    value: value
  };
}

function generateDatas(count) {
  var data = [];
  for (var i = 0; i < count; ++i) {
    data.push(generateData());
  }
  return data;
}


// Create axes
// https://www.amcharts.com/docs/v5/charts/xy-chart/axes/
var xAxis = chart.xAxes.push(am5xy.DateAxis.new(root, {
  maxDeviation: 0,
  baseInterval: {
    timeUnit: "day",
    count: 1
  },
  renderer: am5xy.AxisRendererX.new(root, {
    minorGridEnabled: true,
    minGridDistance: 200,
    minorLabelsEnabled: true
  }),
  tooltip: am5.Tooltip.new(root, {})
}));

xAxis.set("minorDateFormats", {
  day: "dd",
  month: "MM"
});

var yAxis = chart.yAxes.push(am5xy.ValueAxis.new(root, {
  renderer: am5xy.AxisRendererY.new(root, {})
}));


// Add series
// https://www.amcharts.com/docs/v5/charts/xy-chart/series/
var series = chart.series.push(am5xy.LineSeries.new(root, {
  name: "Series",
  xAxis: xAxis,
  yAxis: yAxis,
  valueYField: "value",
  valueXField: "date",
  tooltip: am5.Tooltip.new(root, {
    labelText: "{valueY}"
  })
}));

// Actual bullet
series.bullets.push(function () {
  var bulletCircle = am5.Circle.new(root, {
    radius: 5,
    fill: series.get("fill")
  });
  return am5.Bullet.new(root, {
    sprite: bulletCircle
  })
})

// Add scrollbar
// https://www.amcharts.com/docs/v5/charts/xy-chart/scrollbars/
chart.set("scrollbarX", am5.Scrollbar.new(root, {
  orientation: "horizontal"
}));

var data = generateDatas(30);
series.data.setAll(data);


// Make stuff animate on load
// https://www.amcharts.com/docs/v5/concepts/animations/
series.appear(1000);
chart.appear(1000, 100);

}); // end am5.ready()
</script>

<!-- HTML -->
<div id="chartdiv"></div>