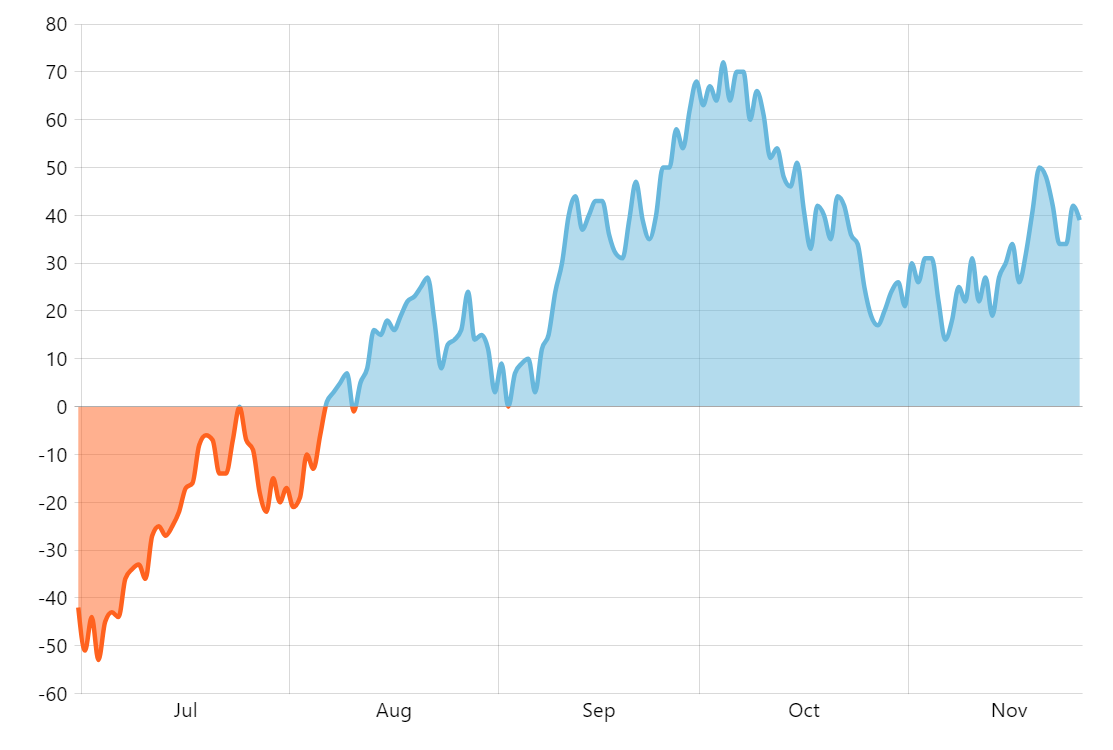
Line with Different Negative Color
Axis ranges
Axis ranges allow defining a scope of values, or a stretch between categories, or dates. Any property of the segment of the series that falls into that range can be overridden.
This demo shows how we can color any segment of the line below the zero line with an alternative color.
More about using axis ranges with series
Demo source
<!-- Styles -->
<style>
#chartdiv {
  width: 100%;
  height: 500px;
}
</style>

<!-- Resources -->
<script src="https://cdn.amcharts.com/lib/5/index.js"></script>
<script src="https://cdn.amcharts.com/lib/5/xy.js"></script>
<script src="https://cdn.amcharts.com/lib/5/radar.js"></script>
<script src="https://cdn.amcharts.com/lib/5/themes/Animated.js"></script>

<!-- Chart code -->
<script>
am5.ready(function() {

// Create root and chart
var root = am5.Root.new("chartdiv");

root.setThemes([am5themes_Animated.new(root)]);

var chart = root.container.children.push(
  am5xy.XYChart.new(root, {
    wheelY: "zoomX"
  })
);

// Define data
var data = generatechartData();
function generatechartData() {
  var chartData = [];
  var firstDate = new Date();
  firstDate.setDate(firstDate.getDate() - 150);
  var visits = -40;
  var b = 0.6;
  for (var i = 0; i < 150; i++) {
    var newDate = new Date(firstDate);
    newDate.setHours(0, 0, 0);
    newDate.setDate(newDate.getDate() + i);
    if (i > 80) {
      b = 0.4;
    }
    visits += Math.round((Math.random() < b ? 1 : -1) * Math.random() * 10);

    chartData.push({
      date: newDate.getTime(),
      visits: visits
    });
  }
  return chartData;
}

// Create Y-axis
var yAxis = chart.yAxes.push(
  am5xy.ValueAxis.new(root, {
    extraTooltipPrecision: 1,
    renderer: am5xy.AxisRendererY.new(root, {
      minGridDistance: 30
    })
  })
);

// Create X-Axis
var xAxis = chart.xAxes.push(
  am5xy.DateAxis.new(root, {
    baseInterval: { timeUnit: "day", count: 1 },
    renderer: am5xy.AxisRendererX.new(root, {
      minorGridEnabled: true,
      cellStartLocation: 0.2,
      cellEndLocation: 0.8
    })
  })
);

// Create series
var series = chart.series.push(
  am5xy.SmoothedXLineSeries.new(root, {
    xAxis: xAxis,
    yAxis: yAxis,
    valueYField: "visits",
    valueXField: "date",
    tooltip: am5.Tooltip.new(root, {
      labelText:"{valueX.formatDate()}: {valueY}",
      pointerOrientation:"horizontal"
    })
  })
);

series.strokes.template.setAll({
  strokeWidth: 3
});

series.fills.template.setAll({
  fillOpacity: 0.5,
  visible: true
});


series.data.setAll(data);

// Create axis ranges

var rangeDataItem = yAxis.makeDataItem({
  value: -1000,
  endValue: 0
});

var range = series.createAxisRange(rangeDataItem);

range.strokes.template.setAll({
  stroke: am5.color(0xff621f),
  strokeWidth: 3
});

range.fills.template.setAll({
  fill: am5.color(0xff621f),
  fillOpacity: 0.5,
  visible: true
});


// Add cursor
chart.set(
  "cursor",
  am5xy.XYCursor.new(root, {
    behavior: "zoomX",
    xAxis: xAxis
  })
);

xAxis.set(
  "tooltip",
  am5.Tooltip.new(root, {
    themeTags: ["axis"]
  })
);

yAxis.set(
  "tooltip",
  am5.Tooltip.new(root, {
    themeTags: ["axis"]
  })
);

}); // end am5.ready()
</script>

<!-- HTML -->
<div id="chartdiv"></div>