Divergent Lines
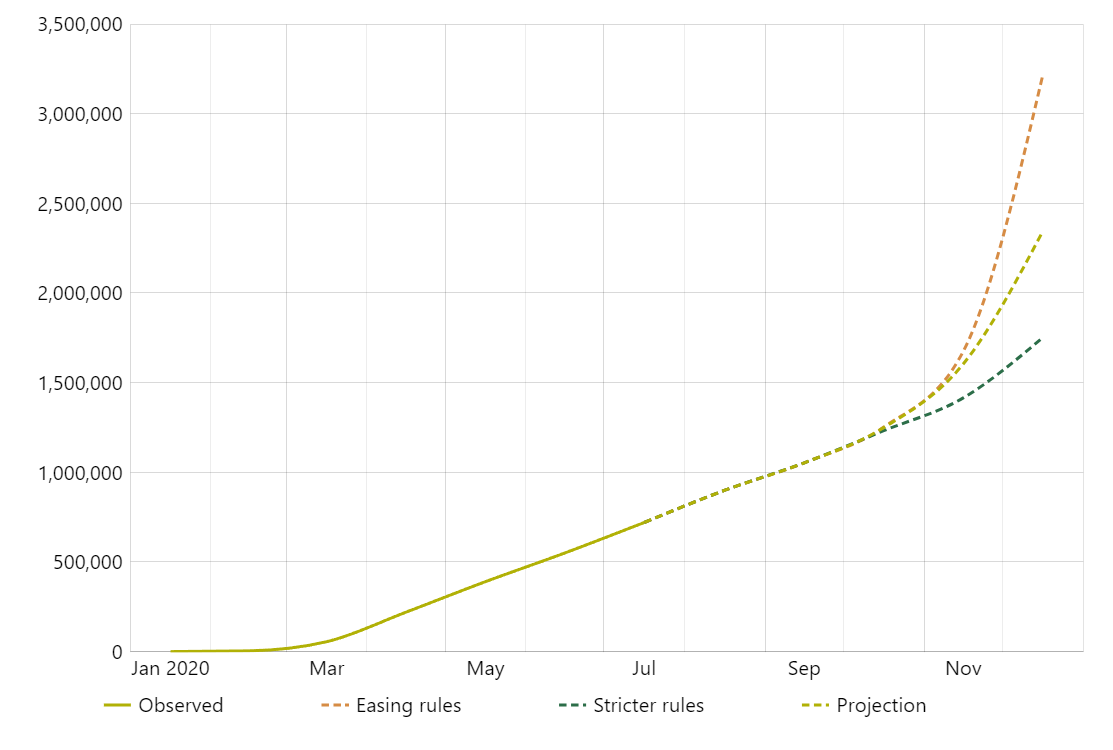
This demo shows how an XYChart can combine several smoothed LineSeries to depict projections using divergent lines. Divergent lines refer to a set of lines that originate from a common point and gradually spread or move apart from each other as they extend further. These lines exhibit a diverging pattern, creating increasing space or distance between them.
Implementation details
We created 4 smoothed line series here: 1 for the observed value range (solid line) and 3 for the projections (dashed). As projection series start where the observed series ends, we gete a continuous looks we are after.
Related tutorials
Demo source
<!-- Styles -->
<style>
#chartdiv {
  width: 100%;
  height: 400px;
}
</style>

<!-- Resources -->
<script src="https://cdn.amcharts.com/lib/5/index.js"></script>
<script src="https://cdn.amcharts.com/lib/5/xy.js"></script>
<script src="https://cdn.amcharts.com/lib/5/themes/Animated.js"></script>

<!-- Chart code -->
<script>
am5.ready(function() {

// Create root element
// https://www.amcharts.com/docs/v5/getting-started/#Root_element
var root = am5.Root.new("chartdiv");


// Set themes
// https://www.amcharts.com/docs/v5/concepts/themes/
root.setThemes([
  am5themes_Animated.new(root)
]);


// Create chart
// https://www.amcharts.com/docs/v5/charts/xy-chart/
var chart = root.container.children.push(am5xy.XYChart.new(root, {
  panX: true,
  panY: true,
  wheelX: "panX",
  wheelY: "zoomX",
  layout: root.verticalLayout,
  pinchZoomX:true
}));

chart.get("colors").set("step", 3);

// Data
var data = [{
  "date": new Date(2020, 0, 1).getTime(),
  "observed": 0
}, {
  "date": new Date(2020, 1, 1).getTime(),
  "observed": 4000
}, {
  "date": new Date(2020, 2, 1).getTime(),
  "observed": 55000
}, {
  "date": new Date(2020, 3, 1).getTime(),
  "observed": 220000
}, {
  "date": new Date(2020, 4, 1).getTime(),
  "observed": 390000
}, {
  "date": new Date(2020, 5, 1).getTime(),
  "observed": 550000
}, {
  "date": new Date(2020, 6, 1).getTime(),
  "observed": 720000,
  "easing": 720000,
  "projection": 720000,
  "stricter": 720000
}, {
  "date": new Date(2020, 7, 1).getTime(),
  "easing": 900000,
  "projection": 900000,
  "stricter": 900000
}, {
  "date": new Date(2020, 8, 1).getTime(),
  "easing": 1053000,
  "projection": 1053000,
  "stricter": 1053000
}, {
  "date": new Date(2020, 9, 1).getTime(),
  "easing": 1252000,
  "projection": 1249000,
  "stricter": 1232000
}, {
  "date": new Date(2020, 10, 1).getTime(),
  "easing": 1674000,
  "projection": 1604000,
  "stricter": 1415000
}, {
  "date": new Date(2020, 11, 1).getTime(),
  "easing": 3212000,
  "projection": 2342000,
  "stricter": 1751000
}];


// Add cursor
// https://www.amcharts.com/docs/v5/charts/xy-chart/cursor/
var cursor = chart.set("cursor", am5xy.XYCursor.new(root, {}));
cursor.lineY.set("visible", false);


// Create axes
// https://www.amcharts.com/docs/v5/charts/xy-chart/axes/
var xAxis = chart.xAxes.push(am5xy.DateAxis.new(root, {
  maxDeviation: 0.3,
  baseInterval: {
    timeUnit: "month",
    count: 1
  },
  renderer: am5xy.AxisRendererX.new(root, {
    minorGridEnabled: true,
    minGridDistance: 60
  }),
  tooltip: am5.Tooltip.new(root, {})
}));

var yAxis = chart.yAxes.push(am5xy.ValueAxis.new(root, {
  maxDeviation: 0.3,
  renderer: am5xy.AxisRendererY.new(root, {})
}));


// Add series
// https://www.amcharts.com/docs/v5/charts/xy-chart/series/
function createSeries(field, name, color, dashed) {
  var series = chart.series.push(am5xy.SmoothedXLineSeries.new(root, {
    name: name,
    xAxis: xAxis,
    yAxis: yAxis,
    valueYField: field,
    valueXField: "date",
    stroke: color,
    tooltip: am5.Tooltip.new(root, {
      pointerOrientation: "horizontal",
      getFillFromSprite: false,
      labelText: "[bold]{name}[/]\n{valueX}: [bold]{valueY}[/]"
    })
  }));

  series.get("tooltip").get("background").setAll({
    fillOpacity: 0.7,
    fill: color,
    pointerBaseWidth: 0
  });

  series.strokes.template.setAll({
    strokeWidth: 2
  });

  if (dashed) {
    series.strokes.template.set("strokeDasharray", [5, 3]);
  }

  series.data.setAll(data);
  series.appear(1000);

  return series;
}

createSeries("observed", "Observed", am5.color(0xB1B106));
createSeries("easing", "Easing rules", am5.color(0xD68C45), true);
createSeries("stricter", "Stricter rules", am5.color(0x2C6E49), true);
createSeries("projection", "Projection", am5.color(0xB1B106), true);


// Set date fields
// https://www.amcharts.com/docs/v5/concepts/data/#Parsing_dates
root.dateFormatter.setAll({
  dateFormat: "yyyy-MM-dd",
  dateFields: ["valueX"]
});


// Add legend
// https://www.amcharts.com/docs/v5/charts/xy-chart/legend-xy-series/
var legend = chart.children.push(
  am5.Legend.new(root, {
    centerX: am5.p50,
    x: am5.p50
  })
);

legend.data.setAll(chart.series.values);


// Make stuff animate on load
// https://www.amcharts.com/docs/v5/concepts/animations/
chart.appear(1000, 100);

}); // end am5.ready()
</script>

<!-- HTML -->
<div id="chartdiv"></div>