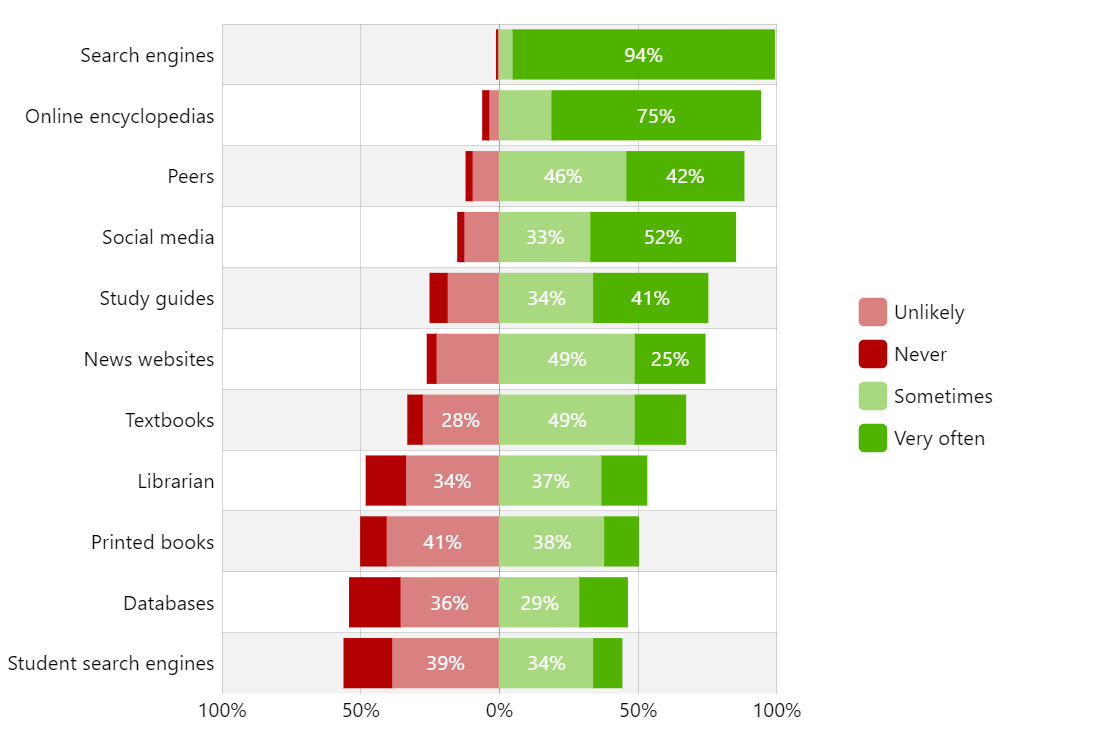
Divergent Stacked Bars
Sometimes you want to stack all the bars in a bar chart on top of each other. Other times, you want some parts of the chart go into diverging directions. This demo shows you a simple way to achieve that with amCharts.
Key implementation details
To achieve this effect we use negative values for bars that need to go to the left of the the axis (0% mark). We format values to display absolute numbers using root.numberFormatter.set("numberFormat", "#.#s'%"); to avoid displaying negative numbers.
Related tutorials
Demo source
<!-- Styles -->
<style>
#chartdiv {
  width: 100%;
  height: 500px;
}
</style>

<!-- Resources -->
<script src="https://cdn.amcharts.com/lib/5/index.js"></script>
<script src="https://cdn.amcharts.com/lib/5/xy.js"></script>
<script src="https://cdn.amcharts.com/lib/5/themes/Animated.js"></script>

<!-- Chart code -->
<script>
am5.ready(function() {

// Create root element
// https://www.amcharts.com/docs/v5/getting-started/#Root_element
var root = am5.Root.new("chartdiv");

// Set themes
// https://www.amcharts.com/docs/v5/concepts/themes/
root.setThemes([
  am5themes_Animated.new(root)
]);

// Create chart
// https://www.amcharts.com/docs/v5/charts/xy-chart/
var chart = root.container.children.push(
  am5xy.XYChart.new(root, {
    panX: false,
    panY: false,
    wheelX: "panX",
    wheelY: "zoomX",
    layout: root.horizontalLayout,
    arrangeTooltips: false,
    paddingLeft: 0
  })
);

// Use only absolute numbers
root.numberFormatter.set("numberFormat", "#.#s'%");

// Add legend
// https://www.amcharts.com/docs/v5/charts/xy-chart/legend-xy-series/
var legend = chart.children.push(
  am5.Legend.new(root, {
    centerX: am5.p50,
    x: am5.p50
  })
);

// Data
var data = [{
  category: "Search engines",
  negative1: -0.1,
  negative2: -0.9,
  positive1: 5,
  positive2: 94
}, {
  category: "Online encyclopedias",
  negative1: -2,
  negative2: -4,
  positive1: 19,
  positive2: 75
}, {
  category: "Peers",
  negative1: -2,
  negative2: -10,
  positive1: 46,
  positive2: 42
}, {
  category: "Social media",
  negative1: -2,
  negative2: -13,
  positive1: 33,
  positive2: 52
}, {
  category: "Study guides",
  negative1: -6,
  negative2: -19,
  positive1: 34,
  positive2: 41
}, {
  category: "News websites",
  negative1: -3,
  negative2: -23,
  positive1: 49,
  positive2: 25
}, {
  category: "Textbooks",
  negative1: -5,
  negative2: -28,
  positive1: 49,
  positive2: 18
}, {
  category: "Librarian",
  negative1: -14,
  negative2: -34,
  positive1: 37,
  positive2: 16
}, {
  category: "Printed books",
  negative1: -9,
  negative2: -41,
  positive1: 38,
  positive2: 12
}, {
  category: "Databases",
  negative1: -18,
  negative2: -36,
  positive1: 29,
  positive2: 17
}, {
  category: "Student search engines",
  negative1: -17,
  negative2: -39,
  positive1: 34,
  positive2: 10
}];

// Create axes
// https://www.amcharts.com/docs/v5/charts/xy-chart/axes/
var yAxis = chart.yAxes.push(
  am5xy.CategoryAxis.new(root, {
    categoryField: "category",
    renderer: am5xy.AxisRendererY.new(root, {
      inversed: true,
      cellStartLocation: 0.1,
      cellEndLocation: 0.9,
      minorGridEnabled: true
    })
  })
);

yAxis.data.setAll(data);

var xAxis = chart.xAxes.push(
  am5xy.ValueAxis.new(root, {
    calculateTotals: true,
    min: -100,
    max: 100,
    renderer: am5xy.AxisRendererX.new(root, {
      minGridDistance: 50
    })
  })
);

var xRenderer = yAxis.get("renderer");
xRenderer.axisFills.template.setAll({
  fill: am5.color(0x000000),
  fillOpacity: 0.05,
  visible: true
});

// Add series
// https://www.amcharts.com/docs/v5/charts/xy-chart/series/
function createSeries(field, name, color) {
  var series = chart.series.push(
    am5xy.ColumnSeries.new(root, {
      xAxis: xAxis,
      yAxis: yAxis,
      name: name,
      valueXField: field,
      categoryYField: "category",
      sequencedInterpolation: true,
      stacked: true,
      fill: color,
      stroke: color,
      calculateAggregates: true
    })
  );

  series.columns.template.setAll({
    height: am5.p100
  });

  series.bullets.push(function(root, series) {
    return am5.Bullet.new(root, {
      locationX: 0.5,
      locationY: 0.5,
      sprite: am5.Label.new(root, {
        fill: am5.color(0xffffff),
        centerX: am5.p50,
        centerY: am5.p50,
        text: "{valueX}",
        populateText: true,
        oversizedBehavior: "hide"
      })
    });
  });

  series.data.setAll(data);
  series.appear();

  return series;
}

var positiveColor = root.interfaceColors.get("positive");
var negativeColor = root.interfaceColors.get("negative");

createSeries("negative2", "Unlikely", am5.Color.lighten(negativeColor, 0.5));
createSeries("negative1", "Never", negativeColor);
createSeries("positive1", "Sometimes", am5.Color.lighten(positiveColor, 0.5));
createSeries("positive2", "Very often", positiveColor);

// Add legend
// https://www.amcharts.com/docs/v5/charts/xy-chart/legend-xy-series/
var legend = chart.children.push(
  am5.Legend.new(root, {
    centerY: am5.p50,
    y: am5.p50,
    layout: root.verticalLayout,
    marginLeft: 50
  })
);

legend.data.setAll(chart.series.values);

// Make stuff animate on load
// https://www.amcharts.com/docs/v5/concepts/animations/
chart.appear(1000, 100);

}); // end am5.ready()
</script>

<!-- HTML -->
<div id="chartdiv"></div>