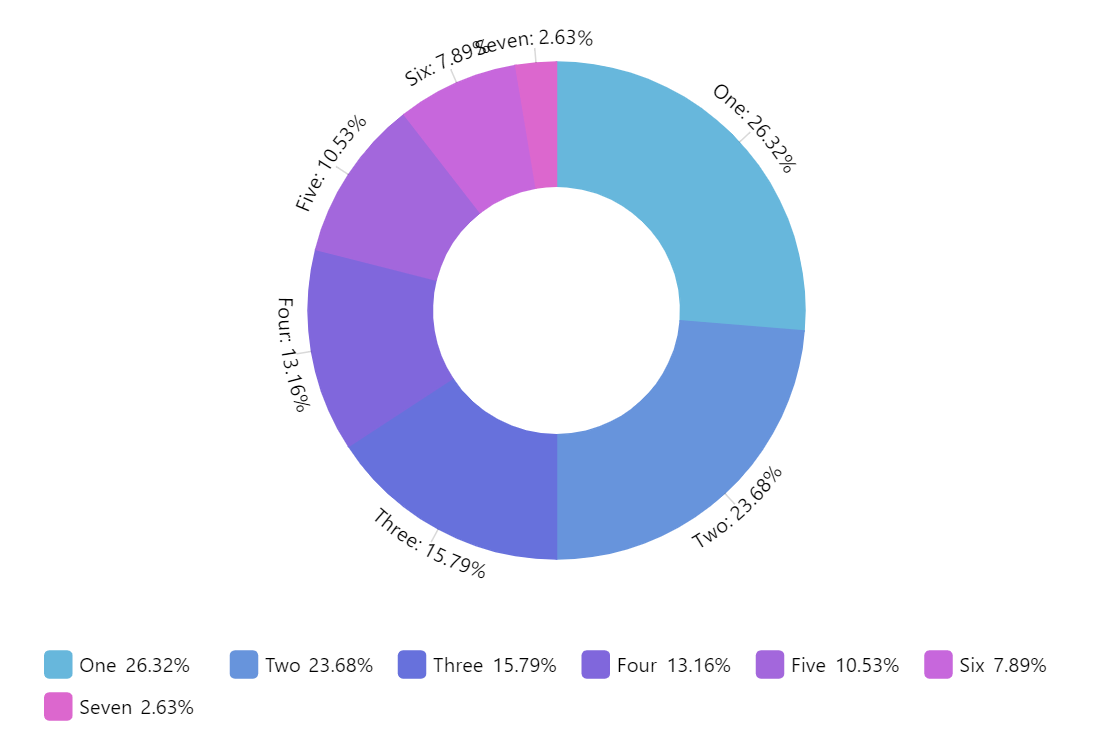
Donut Chart
Donut Chart (also known as Doughnut chart) is a variation on a Pie chart except it has a round hole in the center which makes it look like a donut, hence the name. This empty space can be used to display additional data.
Configurable inner radius
To make a donut chart out of a regular pie chart, we simply need to set innerRadius setting of the chart.
It can either take relative percent value, or fixed pixel radius.
Related tutorials
Demo source
<!-- Styles -->
<style>
#chartdiv {
  width: 100%;
  height: 500px;
}
</style>

<!-- Resources -->
<script src="https://cdn.amcharts.com/lib/5/index.js"></script>
<script src="https://cdn.amcharts.com/lib/5/percent.js"></script>
<script src="https://cdn.amcharts.com/lib/5/themes/Animated.js"></script>

<!-- Chart code -->
<script>
am5.ready(function() {

// Create root element
// https://www.amcharts.com/docs/v5/getting-started/#Root_element
var root = am5.Root.new("chartdiv");


// Set themes
// https://www.amcharts.com/docs/v5/concepts/themes/
root.setThemes([
  am5themes_Animated.new(root)
]);


// Create chart
// https://www.amcharts.com/docs/v5/charts/percent-charts/pie-chart/
var chart = root.container.children.push(am5percent.PieChart.new(root, {
  layout: root.verticalLayout,
  innerRadius: am5.percent(50)
}));


// Create series
// https://www.amcharts.com/docs/v5/charts/percent-charts/pie-chart/#Series
var series = chart.series.push(am5percent.PieSeries.new(root, {
  valueField: "value",
  categoryField: "category",
  alignLabels: false
}));

series.labels.template.setAll({
  textType: "circular",
  centerX: 0,
  centerY: 0
});


// Set data
// https://www.amcharts.com/docs/v5/charts/percent-charts/pie-chart/#Setting_data
series.data.setAll([
  { value: 10, category: "One" },
  { value: 9, category: "Two" },
  { value: 6, category: "Three" },
  { value: 5, category: "Four" },
  { value: 4, category: "Five" },
  { value: 3, category: "Six" },
  { value: 1, category: "Seven" },
]);


// Create legend
// https://www.amcharts.com/docs/v5/charts/percent-charts/legend-percent-series/
var legend = chart.children.push(am5.Legend.new(root, {
  centerX: am5.percent(50),
  x: am5.percent(50),
  marginTop: 15,
  marginBottom: 15,
}));

legend.data.setAll(series.dataItems);


// Play initial series animation
// https://www.amcharts.com/docs/v5/concepts/animations/#Animation_of_series
series.appear(1000, 100);

}); // end am5.ready()
</script>

<!-- HTML -->
<div id="chartdiv"></div>