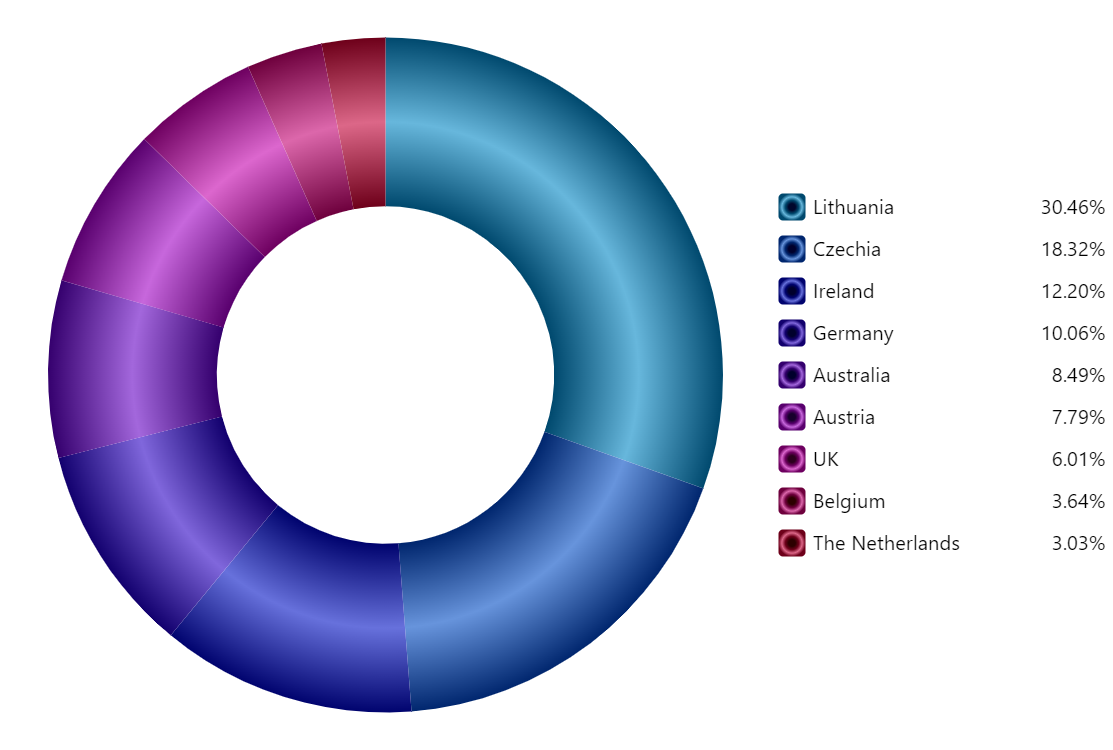
Donut with Radial Gradient
Radial gradient modifiers
amCharts 5 can either use full-fledged gradients or “gradient modifiers” as a fill for just about anything.
A gradient modifier is an easy way to automatically create gradients out of the plain fill colors, for an instant stunning looks of the charts.
Legend
Adding legend to the chart is super easy: you just set legend property of the chart with a new instance of Legend.
The chart will take car of the rest, creating a legend with items for each slice and toggling/hover functionality.
Demo source
<!-- Styles -->
<style>
#chartdiv {
  width: 100%;
  height: 500px;
}
</style>

<!-- Resources -->
<script src="https://cdn.amcharts.com/lib/5/index.js"></script>
<script src="https://cdn.amcharts.com/lib/5/percent.js"></script>
<script src="https://cdn.amcharts.com/lib/5/themes/Animated.js"></script>

<!-- Chart code -->
<script>
am5.ready(function() {

// Create root element
// https://www.amcharts.com/docs/v5/getting-started/#Root_element
var root = am5.Root.new("chartdiv");

// Set themes
// https://www.amcharts.com/docs/v5/concepts/themes/
root.setThemes([
  am5themes_Animated.new(root)
]);

// Create chart
// https://www.amcharts.com/docs/v5/charts/percent-charts/pie-chart/
var chart = root.container.children.push(am5percent.PieChart.new(root, {
  radius: am5.percent(90),
  innerRadius: am5.percent(50),
  layout: root.horizontalLayout
}));

// Create series
// https://www.amcharts.com/docs/v5/charts/percent-charts/pie-chart/#Series
var series = chart.series.push(am5percent.PieSeries.new(root, {
  name: "Series",
  valueField: "sales",
  categoryField: "country"
}));

// Set data
// https://www.amcharts.com/docs/v5/charts/percent-charts/pie-chart/#Setting_data
series.data.setAll([{
  country: "Lithuania",
  sales: 501.9
}, {
  country: "Czechia",
  sales: 301.9
}, {
  country: "Ireland",
  sales: 201.1
}, {
  country: "Germany",
  sales: 165.8
}, {
  country: "Australia",
  sales: 139.9
}, {
  country: "Austria",
  sales: 128.3
}, {
  country: "UK",
  sales: 99
}, {
  country: "Belgium",
  sales: 60
}, {
  country: "The Netherlands",
  sales: 50
}]);

// Disabling labels and ticks
series.labels.template.set("visible", false);
series.ticks.template.set("visible", false);

// Adding gradients
series.slices.template.set("strokeOpacity", 0);
series.slices.template.set("fillGradient", am5.RadialGradient.new(root, {
  stops: [{
    brighten: -0.8
  }, {
    brighten: -0.8
  }, {
    brighten: -0.5
  }, {
    brighten: 0
  }, {
    brighten: -0.5
  }]
}));

// Create legend
// https://www.amcharts.com/docs/v5/charts/percent-charts/legend-percent-series/
var legend = chart.children.push(am5.Legend.new(root, {
  centerY: am5.percent(50),
  y: am5.percent(50),
  layout: root.verticalLayout
}));
// set value labels align to right
legend.valueLabels.template.setAll({ textAlign: "right" })
// set width and max width of labels
legend.labels.template.setAll({
  maxWidth: 140,
  width: 140,
  oversizedBehavior: "wrap"
});

legend.data.setAll(series.dataItems);


// Play initial series animation
// https://www.amcharts.com/docs/v5/concepts/animations/#Animation_of_series
series.appear(1000, 100);

}); // end am5.ready()
</script>

<!-- HTML -->
<div id="chartdiv"></div>