Draggable Range with a Close Button
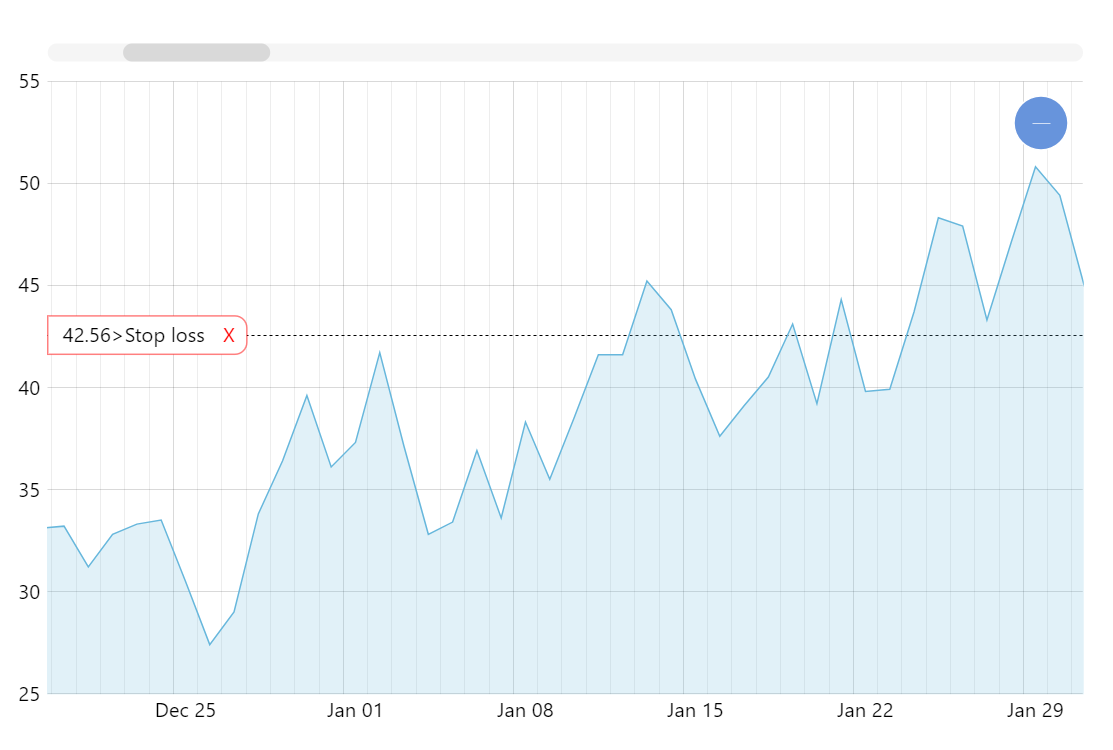
A very common use-case with line and area charts is having some sort of visual indicator to be able to easily see parts of the series going over (or below) some specific value. It is very easy to implement with amCharts’ axis range feature. But we can go one step further and allow the viewer to adjust the indicator value. Try dragging the “Stop loss” indicator box up and down.
Key implementation details
We create an axis range and place a container inside of its bullet to hold our UI elements. Then we add a rounded rectangle, a label, and a close button to the container. Finally, we attach an event handler to the container’s dragged event and update our range position and label value accordingly.
Related tutorials
Demo source
<!-- Styles -->
<style>
#chartdiv {
  width: 100%;
  height: 500px;
max-width: 100%
}
</style>

<!-- Resources -->
<script src="https://cdn.amcharts.com/lib/5/index.js"></script>
<script src="https://cdn.amcharts.com/lib/5/xy.js"></script>
<script src="https://cdn.amcharts.com/lib/5/themes/Animated.js"></script>

<!-- Chart code -->
<script>
am5.ready(function() {


// Create root element
// https://www.amcharts.com/docs/v5/getting-started/#Root_element
var root = am5.Root.new("chartdiv");


// Set themes
// https://www.amcharts.com/docs/v5/concepts/themes/
root.setThemes([
  am5themes_Animated.new(root)
]);


// Create chart
// https://www.amcharts.com/docs/v5/charts/xy-chart/
var chart = root.container.children.push(am5xy.XYChart.new(root, {
  panX: true,
  panY: true,
  wheelX: "panX",
  wheelY: "zoomX",
  pinchZoomX: true,
  paddingLeft: 0
}));


// Add cursor
// https://www.amcharts.com/docs/v5/charts/xy-chart/cursor/
var cursor = chart.set("cursor", am5xy.XYCursor.new(root, {}));
cursor.lineX.set("forceHidden", true);
cursor.lineY.set("forceHidden", true);

// Generate random data
var date = new Date();
date.setHours(0, 0, 0, 0);

var value = 20;
function generateData() {
  value = am5.math.round(Math.random() * 10 - 4.8 + value, 1);
  if (value < 0) {
    value = Math.random() * 10;
  }

  if (value > 100) {
    value = 100 - Math.random() * 10;
  }
  am5.time.add(date, "day", 1);
  return {
    date: date.getTime(),
    value: value
  };
}

function generateDatas(count) {
  var data = [];
  for (var i = 0; i < count; ++i) {
    data.push(generateData());
  }
  return data;
}


// Create axes
// https://www.amcharts.com/docs/v5/charts/xy-chart/axes/
var xAxis = chart.xAxes.push(am5xy.DateAxis.new(root, {
  baseInterval: {
    timeUnit: "day",
    count: 1
  },
  renderer: am5xy.AxisRendererX.new(root, {
    minorGridEnabled: true,
    minGridDistance: 90
  })
}));

var yAxis = chart.yAxes.push(am5xy.ValueAxis.new(root, {
  renderer: am5xy.AxisRendererY.new(root, {})
}));


// Add series
// https://www.amcharts.com/docs/v5/charts/xy-chart/series/
var series = chart.series.push(am5xy.LineSeries.new(root, {
  name: "Series",
  xAxis: xAxis,
  yAxis: yAxis,
  valueYField: "value",
  valueXField: "date",
  tooltip: am5.Tooltip.new(root, {
    labelText: "{valueY}"
  })
}));

series.fills.template.setAll({
  fillOpacity: 0.2,
  visible: true
});


// Add scrollbar
// https://www.amcharts.com/docs/v5/charts/xy-chart/scrollbars/
chart.set("scrollbarX", am5.Scrollbar.new(root, {
  orientation: "horizontal"
}));

// DRAGGABLE RANGE
// add series range
var rangeDataItem = yAxis.makeDataItem({});
yAxis.createAxisRange(rangeDataItem);

// create container for all elements, you can put anything you want top it
var container = am5.Container.new(root, {
  centerY: am5.p50,
  draggable: true,
  layout: root.horizontalLayout
})

// restrict from being dragged vertically
container.adapters.add("x", function() {
  return 0;
});

// restrict from being dragged outside of plot
container.adapters.add("y", function(y) {
  return Math.max(0, Math.min(chart.plotContainer.height(), y));
});

// change range when y changes
container.events.on("dragged", function() {
  updateLabel();
});

// this is needed for the bullets to be interactive, above the plot
yAxis.topGridContainer.children.push(container);

// create bullet and set container as a bullets sprite
rangeDataItem.set("bullet", am5xy.AxisBullet.new(root, {
  sprite: container
}));

// decorate grid of a range
rangeDataItem.get("grid").setAll({
  strokeOpacity: 1,
  visible: true,
  stroke: am5.color(0x000000),
  strokeDasharray: [2, 2]
})

// create background for the container
var background = am5.RoundedRectangle.new(root, {
  fill: am5.color(0xffffff),
  fillOpacity: 1,
  strokeOpacity: 0.5,
  cornerRadiusTL: 0,
  cornerRadiusBL: 0,
  cursorOverStyle: "ns-resize",
  stroke: am5.color(0xff0000)
})

container.set("background", background);

// add label to container, this one will show value and text
var label = container.children.push(am5.Label.new(root, {
  paddingTop: 5,
  paddingBottom: 5
}))

// add x button
var xButton = container.children.push(am5.Button.new(root, {
  cursorOverStyle: "pointer",
  paddingTop: 5,
  paddingBottom: 5,
  paddingLeft: 2,
  paddingRight: 8
}))

// add label to the button (you can add icon instead of a label)
xButton.set("label", am5.Label.new(root, {
  text: "X",
  paddingBottom: 0,
  paddingTop: 0,
  paddingRight: 0,
  paddingLeft: 0,
  fill: am5.color(0xff0000)
}))

// modify background of x button
xButton.get("background").setAll({
  strokeOpacity: 0,
  fillOpacity: 0
})

// dispose item when x button is clicked
xButton.events.on("click", function() {
  yAxis.disposeDataItem(rangeDataItem);
})

function updateLabel(value) {
  var y = container.y();
  var position = yAxis.toAxisPosition(y / chart.plotContainer.height());

  if(value == null){
    value = yAxis.positionToValue(position);
  }

  label.set("text", root.numberFormatter.format(value, "#.00") + ">Stop loss");

  rangeDataItem.set("value", value);
}

// when data is validated, set range value to the middle
series.events.on("datavalidated", () => {
  var max = yAxis.getPrivate("max", 1);
  var min = yAxis.getPrivate("min", 0);

  var value = min + (max - min) / 2;
  rangeDataItem.set("value", value);
  updateLabel(value);
})

// Set data
var data = generateDatas(300);
series.data.setAll(data);

// Make stuff animate on load
// https://www.amcharts.com/docs/v5/concepts/animations/
series.appear(1000);
chart.appear(1000, 100);


}); // end am5.ready()
</script>

<!-- HTML -->
<div id="chartdiv"></div>