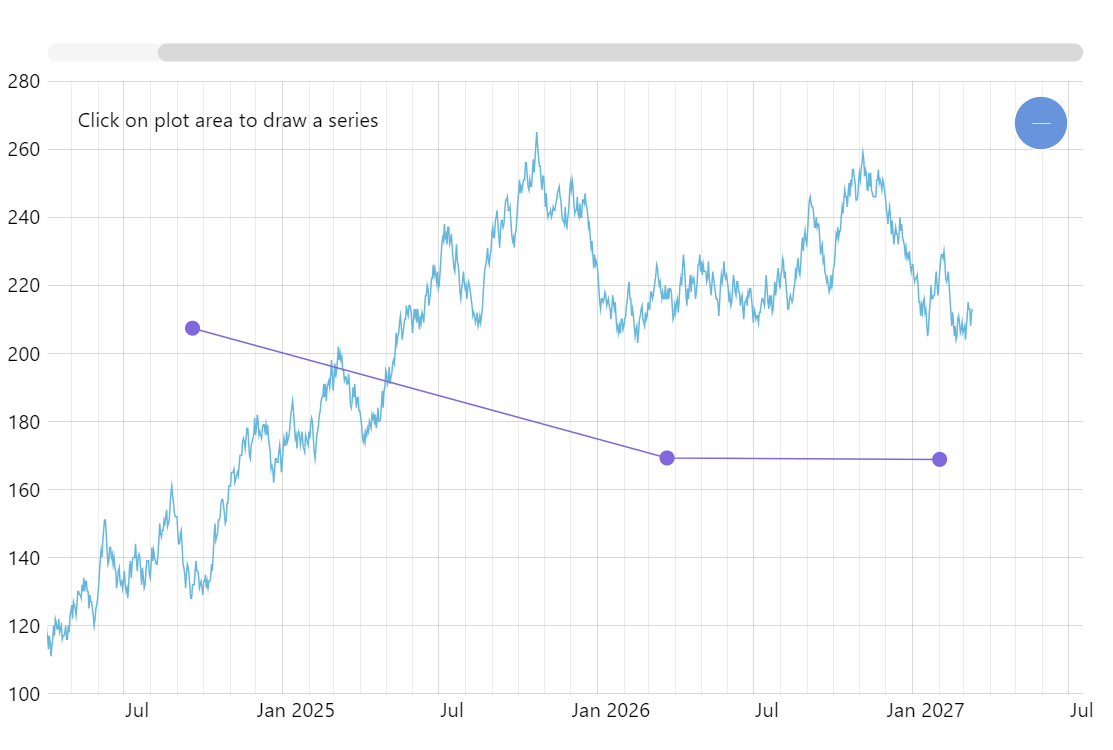
Drawing Chart Series with Mouse or Touch
Your charts don’t have to be limited to passively displaying data. You can use amCharts as an interactive chart creation surface and enable your users to visually draw new charts. Click anywhere on plot area to draw the new series, drag bullets to adjust positions.
Related tutorials
Demo source
<!-- Styles -->
<style>
#chartdiv {
  width: 100%;
  height: 500px;
}
</style>

<!-- Resources -->
<script src="https://cdn.amcharts.com/lib/5/index.js"></script>
<script src="https://cdn.amcharts.com/lib/5/xy.js"></script>
<script src="https://cdn.amcharts.com/lib/5/themes/Animated.js"></script>

<!-- Chart code -->
<script>
am5.ready(function() {

// Create root element
// https://www.amcharts.com/docs/v5/getting-started/#Root_element
var root = am5.Root.new("chartdiv");


// Set themes
// https://www.amcharts.com/docs/v5/concepts/themes/
root.setThemes([
  am5themes_Animated.new(root)
]);


// Create chart
// https://www.amcharts.com/docs/v5/charts/xy-chart/
var chart = root.container.children.push(am5xy.XYChart.new(root, {
  panX: true,
  panY: true,
  wheelX: "panX",
  wheelY: "zoomX",
  pinchZoomX: true,
  paddingLeft: 0
}));

chart.get("colors").set("step", 3);


// Add cursor
// https://www.amcharts.com/docs/v5/charts/xy-chart/cursor/
var cursor = chart.set("cursor", am5xy.XYCursor.new(root, {}));
cursor.lineY.set("visible", false);


// Generate random data
var date = new Date();
date.setHours(0, 0, 0, 0);
var value = 100;

function generateData() {
  value = Math.round((Math.random() * 10 - 5) + value);
  am5.time.add(date, "day", 1);
  return {
    date: date.getTime(),
    value: value
  };
}

function generateDatas(count) {
  var data = [];
  for (var i = 0; i < count; ++i) {
    data.push(generateData());
  }
  return data;
}


// Create axes
// https://www.amcharts.com/docs/v5/charts/xy-chart/axes/
var xAxis = chart.xAxes.push(am5xy.DateAxis.new(root, {
  maxDeviation: 0.3,
  baseInterval: {
    timeUnit: "day",
    count: 1
  },
  renderer: am5xy.AxisRendererX.new(root, {
    minorGridEnabled: true,
    minGridDistance: 70
  }),
  tooltip: am5.Tooltip.new(root, {})
}));

var yAxis = chart.yAxes.push(am5xy.ValueAxis.new(root, {
  maxDeviation: 0.3,
  renderer: am5xy.AxisRendererY.new(root, {})
}));


var series = chart.series.push(am5xy.LineSeries.new(root, {
  name: "Series",
  xAxis: xAxis,
  yAxis: yAxis,
  valueYField: "value",
  valueXField: "date",
  tooltip: am5.Tooltip.new(root, {
    labelText: "{valueY}"
  })
}));

var drawingSeries = chart.series.push(am5xy.LineSeries.new(root, {
  name: "Series",
  xAxis: xAxis,
  yAxis: yAxis,
  valueYField: "value",
  valueXField: "date"
}));

// Invisible bullet which will be dragged (to avoid some conflicting between
// drag position and bullet position which results flicker)
drawingSeries.bullets.push(function () {
  var bulletCircle = am5.Circle.new(root, {
    radius: 6,
    fillOpacity: 0,
    fill: drawingSeries.get("fill"),
    draggable: true,
    cursorOverStyle: "pointer"
  });
  bulletCircle.events.on("dragged", function (e) {
    handleDrag(e);
  })
  return am5.Bullet.new(root, {
    sprite: bulletCircle
  })
})

// Actual bullet
drawingSeries.bullets.push(function () {
  var bulletCircle = am5.Circle.new(root, {
    radius: 5,
    fill: drawingSeries.get("fill")
  });
  return am5.Bullet.new(root, {
    sprite: bulletCircle
  })
})

// Drag handler
function handleDrag(e) {
  var point = chart.plotContainer.toLocal(e.point);
  var date = xAxis.positionToValue(xAxis.coordinateToPosition(point.x));
  var value = yAxis.positionToValue(yAxis.coordinateToPosition(point.y));

  var dataItem = e.target.dataItem;
  dataItem.set("valueX", date);
  dataItem.set("valueXWorking", date);
  dataItem.set("valueY", value);
  dataItem.set("valueYWorking", value);
}


// Add scrollbar
// https://www.amcharts.com/docs/v5/charts/xy-chart/scrollbars/
chart.set("scrollbarX", am5.Scrollbar.new(root, {
  orientation: "horizontal"
}));


// Set data
var data = generateDatas(1200);
series.data.setAll(data);


// Make stuff animate on load
// https://www.amcharts.com/docs/v5/concepts/animations/
series.appear(1000);
chart.appear(1000, 100);

// Interactivity
chart.plotContainer.get("background").events.on("click", function (e) {
  var point = chart.plotContainer.toLocal(e.point);
  var date = xAxis.positionToValue(xAxis.coordinateToPosition(point.x));
  var value = yAxis.positionToValue(yAxis.coordinateToPosition(point.y));
  drawingSeries.data.push({
    date: date,
    value: value
  });

  drawingSeries.setPrivate("endIndex", drawingSeries.data.length);
  sortData();
})


// Sort data so that if clicked between existing data items, the item would
// be added between
function sortData() {
  drawingSeries.dataItems.sort(function (a, b) {
    var atime = a.get("valueX");
    var btime = b.get("valueX");

    if (atime < btime) {
      return -1;
    } else if (atime == btime) {
      return 0;
    } else {
      return 1;
    }
  })
}

// Explanatory labels
chart.plotContainer.children.push(am5.Label.new(root, {
  x: 10,
  y: 10,
  text: "Click on plot area to draw a series"
}));

}); // end am5.ready()
</script>

<!-- HTML -->
<div id="chartdiv"></div>