Drill-down Congressional Map
This demo uses a state map of the USA on its first level.
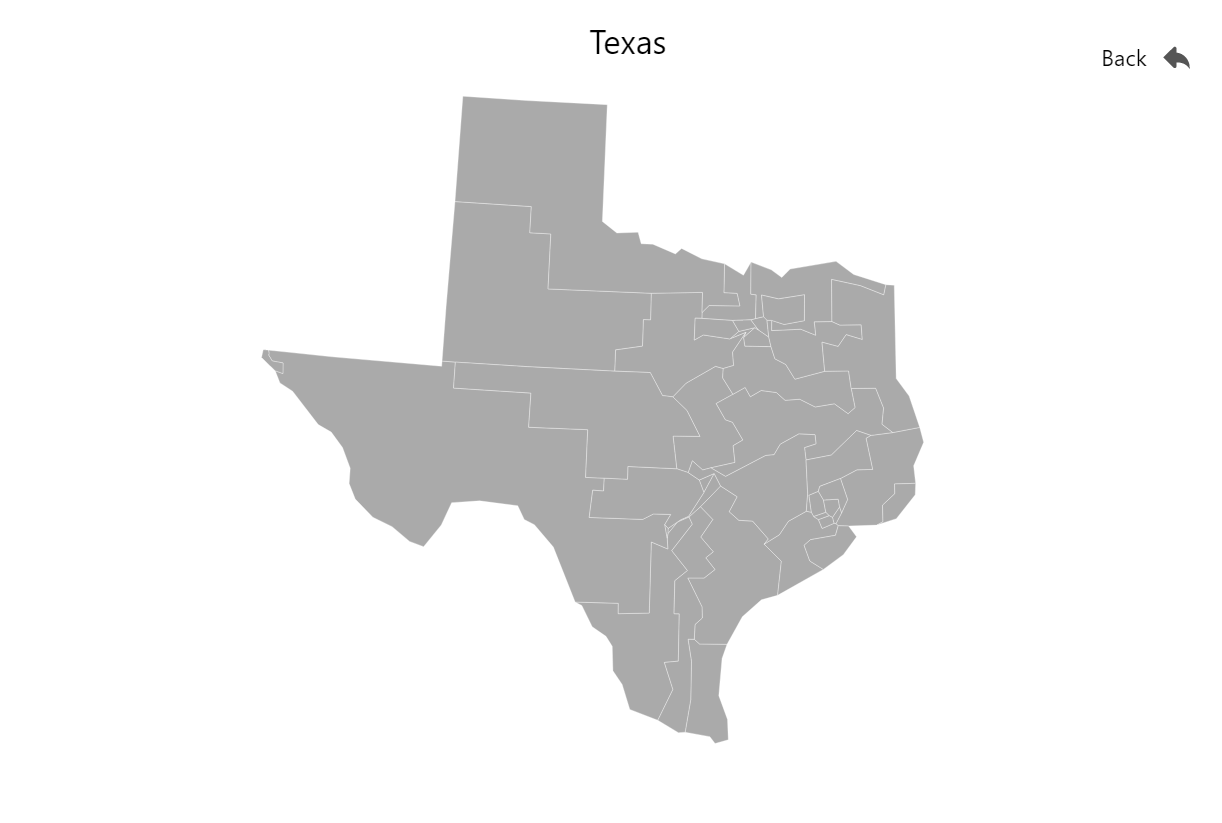
Upon click of the state, it dynamically loads Congressional Districts map of that state, as well as transitions to it.
Related tutorials
Demo source
<!-- Styles -->
<style>
#chartdiv {
  width: 100%;
  height: 500px;
}
</style>

<!-- Resources -->
<script src="https://cdn.amcharts.com/lib/5/index.js"></script>
<script src="https://cdn.amcharts.com/lib/5/map.js"></script>
<script src="https://cdn.amcharts.com/lib/5/themes/Animated.js"></script>
<script src="https://cdn.amcharts.com/lib/5/geodata/usaLow.js"></script>

<!-- Chart code -->
<script>
am5.ready(function() {

// Create root element
// https://www.amcharts.com/docs/v5/getting-started/#Root_element
var root = am5.Root.new("chartdiv");
var colors = am5.ColorSet.new(root, {});


// Set themes
// https://www.amcharts.com/docs/v5/concepts/themes/
root.setThemes([
  am5themes_Animated.new(root)
]);


// Create the map chart
// https://www.amcharts.com/docs/v5/charts/map-chart/
var chart = root.container.children.push(am5map.MapChart.new(root, {
  panX: "rotateX",
  projection: am5map.geoAlbersUsa()
}));


// Create polygon series for the world map
// https://www.amcharts.com/docs/v5/charts/map-chart/map-polygon-series/
var usaSeries = chart.series.push(am5map.MapPolygonSeries.new(root, {
  geoJSON: am5geodata_usaLow
}));

usaSeries.mapPolygons.template.setAll({
  tooltipText: "{name}",
  interactive: true,
  fill: am5.color(0xaaaaaa),
  templateField: "polygonSettings"
});

usaSeries.mapPolygons.template.states.create("hover", {
  fill: colors.getIndex(9)
});

usaSeries.mapPolygons.template.events.on("click", (ev) => {
  var dataItem = ev.target.dataItem;
  var id = dataItem.get("id").toLowerCase().split("-").pop();
  var name = dataItem.dataContext.name;
  var zoomAnimation = usaSeries.zoomToDataItem(dataItem);

  Promise.all([
    zoomAnimation.waitForStop(),
    am5.net.load("https://cdn.amcharts.com/lib/5/geodata/json/region/usa/congressional2022/" + id + "Low.json", chart)
  ]).then(function(results) {
    var geodata = am5.JSONParser.parse(results[1].response);
    stateSeries.setAll({
      geoJSON: geodata
    });

    stateSeries.show();
    usaSeries.hide(100);
    backContainer.show();
    title.set("text", name);
  });
});

// Create polygon series for the country map
// https://www.amcharts.com/docs/v5/charts/map-chart/map-polygon-series/
var stateSeries = chart.series.push(am5map.MapPolygonSeries.new(root, {
  visible: false
}));

stateSeries.mapPolygons.template.setAll({
  tooltipText: "{name}",
  interactive: true,
  fill: am5.color(0xaaaaaa)
});

stateSeries.mapPolygons.template.states.create("hover", {
  fill: colors.getIndex(9)
});


// Add button to go back to continents view
var backContainer = chart.children.push(am5.Container.new(root, {
  x: am5.p100,
  centerX: am5.p100,
  dx: -10,
  paddingTop: 5,
  paddingRight: 10,
  paddingBottom: 5,
  y: 30,
  interactiveChildren: false,
  layout: root.horizontalLayout,
  cursorOverStyle: "pointer",
  background: am5.RoundedRectangle.new(root, {
    fill: am5.color(0xffffff),
    fillOpacity: 0.2
  }),
  visible: false
}));

var backLabel = backContainer.children.push(am5.Label.new(root, {
  text: "Back",
  centerY: am5.p50
}));

var backButton = backContainer.children.push(am5.Graphics.new(root, {
  width: 32,
  height: 32,
  centerY: am5.p50,
  fill: am5.color(0x555555),
  svgPath: "M12 9.059V6.5a1.001 1.001 0 0 0-1.707-.708L4 12l6.293 6.207a.997.997 0 0 0 1.414 0A.999.999 0 0 0 12 17.5v-2.489c2.75.068 5.755.566 8 3.989v-1c0-4.633-3.5-8.443-8-8.941z"
}));

backContainer.events.on("click", function() {
  chart.goHome();
  usaSeries.show();
  stateSeries.hide();
  backContainer.hide();
  title.set("text", "United States");
});

var title = chart.children.push(am5.Label.new(root, {
  text: "United States",
  x: am5.p50,
  y: 5,
  fontSize: 20,
  textAlign: "center"
}));

}); // end am5.ready()
</script>

<!-- HTML -->
<div id="chartdiv"></div>