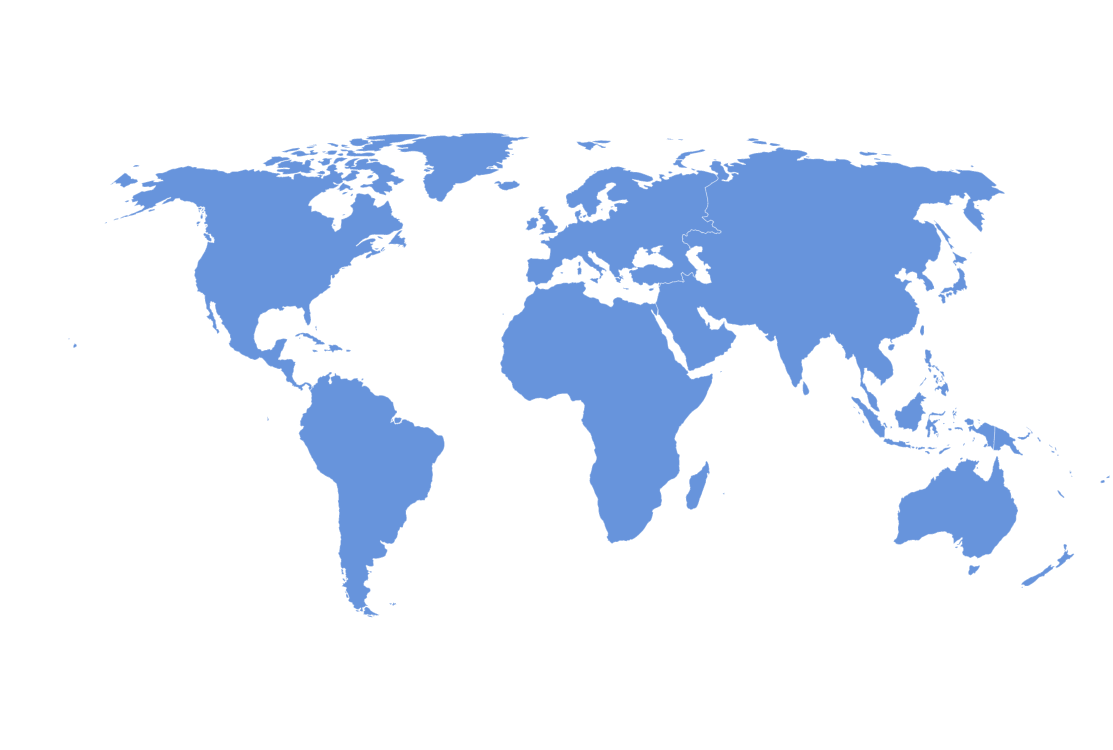
Drill-Down Map
Click on any continent – the map will be zoomed-in and then a country-level map will be displayed. You can easily create drill-down maps using our product.
Related tutorials
Demo source
<!-- Styles -->
<style>
#chartdiv {
  width: 100%;
  height: 500px;
}
</style>

<!-- Resources -->
<script src="https://cdn.amcharts.com/lib/5/index.js"></script>
<script src="https://cdn.amcharts.com/lib/5/map.js"></script>
<script src="https://cdn.amcharts.com/lib/5/geodata/continentsLow.js"></script>
<script src="https://cdn.amcharts.com/lib/5/geodata/worldLow.js"></script>
<script src="https://cdn.amcharts.com/lib/5/themes/Animated.js"></script>

<!-- Chart code -->
<script>
am5.ready(function() {

// Create root element
// https://www.amcharts.com/docs/v5/getting-started/#Root_element
var root = am5.Root.new("chartdiv");


// Set themes
// https://www.amcharts.com/docs/v5/concepts/themes/
root.setThemes([
  am5themes_Animated.new(root)
]);


// Create the map chart
// https://www.amcharts.com/docs/v5/charts/map-chart/
var chart = root.container.children.push(am5map.MapChart.new(root, {
  panX: "rotateX",
  projection: am5map.geoNaturalEarth1()
}));


// Create polygon series for continents
// https://www.amcharts.com/docs/v5/charts/map-chart/map-polygon-series/
var continentSeries = chart.series.push(am5map.MapPolygonSeries.new(root, {
  geoJSON: am5geodata_continentsLow,
  exclude: ["antarctica"]
}));

continentSeries.mapPolygons.template.setAll({
  tooltipText: "{name}",
  interactive: true
});

continentSeries.mapPolygons.template.states.create("hover", {
  fill: root.interfaceColors.get("primaryButtonActive")
});

// Set up zooming in on clicked continent
continentSeries.mapPolygons.template.events.on("click", function (ev) {
  continentSeries.zoomToDataItem(ev.target.dataItem);
  continentSeries.hide();
  countrySeries.show();
  homeButton.show();
});


// Create polygon series for countries
// https://www.amcharts.com/docs/v5/charts/map-chart/map-polygon-series/
var countrySeries = chart.series.push(am5map.MapPolygonSeries.new(root, {
  geoJSON: am5geodata_worldLow,
  exclude: ["AQ"],
  visible: false
}));

countrySeries.mapPolygons.template.setAll({
  tooltipText: "{name}",
  interactive: true
});

countrySeries.mapPolygons.template.states.create("hover", {
  fill: root.interfaceColors.get("primaryButtonActive")
});


// Add a button to go back to continents view
var homeButton = chart.children.push(am5.Button.new(root, {
  paddingTop: 10,
  paddingBottom: 10,
  x: am5.percent(100),
  centerX: am5.percent(100),
  opacity: 0,
  interactiveChildren: false,
  icon: am5.Graphics.new(root, {
    svgPath: "M16,8 L14,8 L14,16 L10,16 L10,10 L6,10 L6,16 L2,16 L2,8 L0,8 L8,0 L16,8 Z M16,8",
    fill: am5.color(0xffffff)
  })
}));

homeButton.events.on("click", function() {
  chart.goHome();
  continentSeries.show();
  countrySeries.hide();
  homeButton.hide();
});

}); // end am5.ready()
</script>

<!-- HTML -->
<div id="chartdiv"></div>