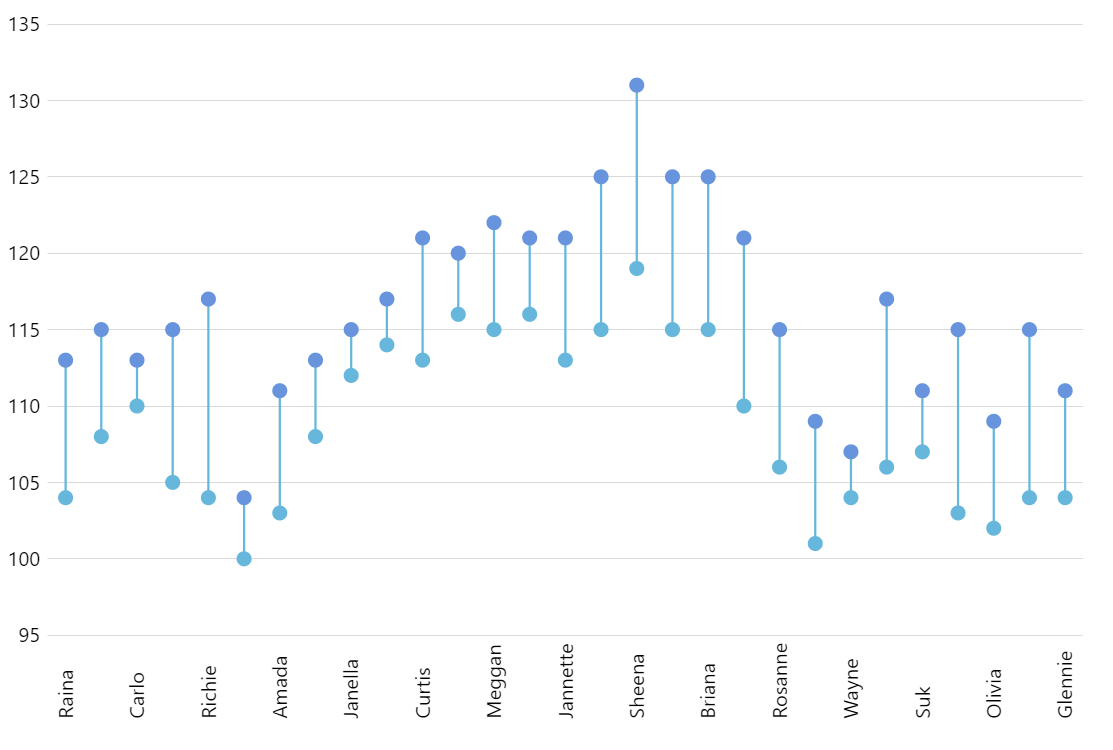
Dumbbell Plot
Dumbbell plot (also known as Dumbbell chart, Connected dot plot) is great for displaying changes between two points in time, two conditions or differences between two groups.
See also: Horizontal dumbbell plot demo.
Key implementation details
The dumbbells are just narrow columns with openValueYField set to the open value (so that they don’t start on the axis).
Related tutorials
Demo source
<!-- Styles -->
<style>
#chartdiv {
  width: 100%;
  height: 500px;
}
</style>

<!-- Resources -->
<script src="https://cdn.amcharts.com/lib/5/index.js"></script>
<script src="https://cdn.amcharts.com/lib/5/xy.js"></script>
<script src="https://cdn.amcharts.com/lib/5/themes/Animated.js"></script>

<!-- Chart code -->
<script>
am5.ready(function() {


// Create root element
// https://www.amcharts.com/docs/v5/getting-started/#Root_element
var root = am5.Root.new("chartdiv");


// Set themes
// https://www.amcharts.com/docs/v5/concepts/themes/
root.setThemes([
  am5themes_Animated.new(root)
]);


// Create chart
// https://www.amcharts.com/docs/v5/charts/xy-chart/
var chart = root.container.children.push(am5xy.XYChart.new(root, {
  panX: true,
  panY: true,
  wheelX: "panX",
  wheelY: "zoomX",
  pinchZoomX: true,
  paddingLeft: 0
}));

// Add cursor
// https://www.amcharts.com/docs/v5/charts/xy-chart/cursor/
var cursor = chart.set("cursor", am5xy.XYCursor.new(root, {}));
cursor.lineY.set("visible", false);


// Create axes
// https://www.amcharts.com/docs/v5/charts/xy-chart/axes/
var xRenderer = am5xy.AxisRendererX.new(root, {
  minGridDistance: 30,
  minorGridEnabled: true
});
xRenderer.labels.template.setAll({
  rotation: -90,
  centerY: am5.p50,
  centerX: 0
});

xRenderer.grid.template.setAll({
  visible: false
})

var xAxis = chart.xAxes.push(am5xy.CategoryAxis.new(root, {
  maxDeviation: 0.3,
  categoryField: "category",
  renderer: xRenderer,
  tooltip: am5.Tooltip.new(root, {})
}));

var yAxis = chart.yAxes.push(am5xy.ValueAxis.new(root, {
  maxDeviation: 0.3,
  renderer: am5xy.AxisRendererY.new(root, {})
}));


// Create series
// https://www.amcharts.com/docs/v5/charts/xy-chart/series/
var series = chart.series.push(am5xy.ColumnSeries.new(root, {
  name: "Series 1",
  xAxis: xAxis,
  yAxis: yAxis,
  valueYField: "close",
  openValueYField: "open",
  categoryXField: "category",
  tooltip: am5.Tooltip.new(root, {
    labelText: "{openValueY} - {valueY}"
  })
}));
series.columns.template.setAll({
  width: 0.5
});

series.bullets.push(function() {
  return am5.Bullet.new(root, {
    locationY: 0,
    sprite: am5.Circle.new(root, {
      radius: 5,
      fill: series.get("fill")
    })
  })
})

var nextColor = chart.get("colors").getIndex(1);

series.bullets.push(function() {
  return am5.Bullet.new(root, {
    locationY: 1,
    sprite: am5.Circle.new(root, {
      radius: 5,
      fill: nextColor
    })
  })
})

// Set data
var data = [];
var open = 100;
var close = 120;

var names = ["Raina",
  "Demarcus",
  "Carlo",
  "Jacinda",
  "Richie",
  "Antony",
  "Amada",
  "Idalia",
  "Janella",
  "Marla",
  "Curtis",
  "Shellie",
  "Meggan",
  "Nathanael",
  "Jannette",
  "Tyrell",
  "Sheena",
  "Maranda",
  "Briana",
  "Rosa",
  "Rosanne",
  "Herman",
  "Wayne",
  "Shamika",
  "Suk",
  "Clair",
  "Olivia",
  "Hans",
  "Glennie"
];

for (var i = 0; i < names.length; i++) {
  open += Math.round((Math.random() < 0.5 ? 1 : -1) * Math.random() * 5);
  close = open + Math.round(Math.random() * 10) + 3;
  data.push({
    category: names[i],
    open: open,
    close: close
  });
}

xAxis.data.setAll(data);
series.data.setAll(data);


// Make stuff animate on load
// https://www.amcharts.com/docs/v5/concepts/animations/
series.appear(1000);
chart.appear(1000, 100);

}); // end am5.ready()
</script>

<!-- HTML -->
<div id="chartdiv"></div>