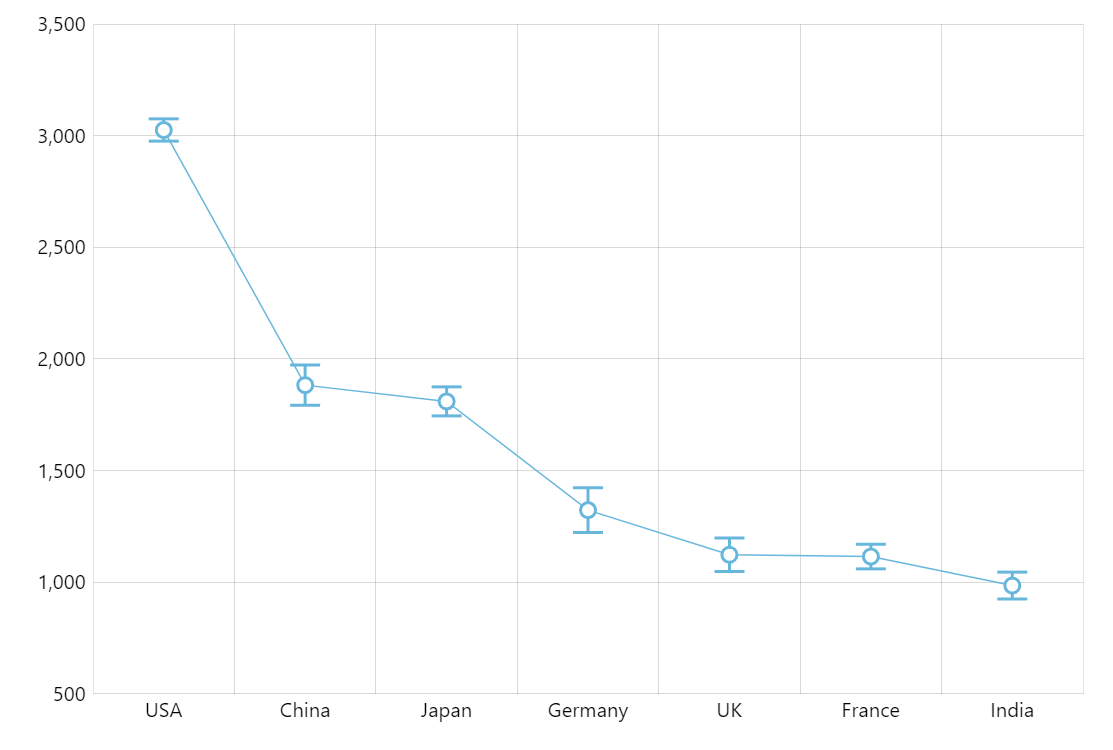
Error Chart
Error chart helps you visualize uncertainty or variability of data. This demo shows you how to create error bars on top of a regular line graph.
Key implementation details
Our main chart is just a line series and we add error bars by utilizing advanced bullet functionality in amCharts. Bullets can be all kinds of objects in amCharts and this case we create a Graphics bullet so we can draw an arbitrary shape according to our needs.
Related tutorials
Demo source
<!-- Styles -->
<style>
#chartdiv {
  width: 100%;
  height: 500px;
}
</style>

<!-- Resources -->
<script src="https://cdn.amcharts.com/lib/5/index.js"></script>
<script src="https://cdn.amcharts.com/lib/5/xy.js"></script>
<script src="https://cdn.amcharts.com/lib/5/themes/Animated.js"></script>

<!-- Chart code -->
<script>
am5.ready(function() {


var data = [
  {
    country: "USA",
    visits: 3025,
    error: 100
  },
  {
    country: "China",
    visits: 1882,
    error: 180
  },
  {
    country: "Japan",
    visits: 1809,
    error: 130
  },
  {
    country: "Germany",
    visits: 1322,
    error: 200
  },
  {
    country: "UK",
    visits: 1122,
    error: 150
  },
  {
    country: "France",
    visits: 1114,
    error: 110
  },
  {
    country: "India",
    visits: 984,
    error: 120
  }
];

// Create root element
// https://www.amcharts.com/docs/v5/getting-started/#Root_element
var root = am5.Root.new("chartdiv");

// Set themes
// https://www.amcharts.com/docs/v5/concepts/themes/
root.setThemes([
  am5themes_Animated.new(root)
]);

// Create chart
// https://www.amcharts.com/docs/v5/charts/xy-chart/
var chart = root.container.children.push(
  am5xy.XYChart.new(root, {
    panX: true,
    panY: true,
    wheelY: "zoomXY",
    pinchZoomX: true
  })
);

chart.get("colors").set("step", 2);

// Create axes
// https://www.amcharts.com/docs/v5/charts/xy-chart/axes/

var xRenderer = am5xy.AxisRendererX.new(root, {
  minGridDistance: 50,
  minorGridEnabled: true
});

var xAxis = chart.xAxes.push(
  am5xy.CategoryAxis.new(root, {
    categoryField: "country",
    renderer: xRenderer,
    tooltip: am5.Tooltip.new(root, {})
  })
);

xRenderer.grid.template.setAll({
  location: 1
})

var yAxis = chart.yAxes.push(
  am5xy.ValueAxis.new(root, {
    extraMax: 0.1,
    extraMin: 0.1,
    renderer: am5xy.AxisRendererY.new(root, {
      strokeOpacity: 0.1
    }),
    tooltip: am5.Tooltip.new(root, {})
  })
);

// Create series
// https://www.amcharts.com/docs/v5/charts/xy-chart/series/
var series = chart.series.push(
  am5xy.LineSeries.new(root, {
    calculateAggregates: true,
    xAxis: xAxis,
    yAxis: yAxis,
    valueYField: "visits",
    categoryXField: "country",
    tooltip: am5.Tooltip.new(root, {
      labelText: "value: {valueY}\nerror: {error}"
    })
  })
);

// add error bullet
series.bullets.push(function() {
  var graphics = am5.Graphics.new(root, {
    strokeWidth: 2,
    stroke: series.get("stroke"),
    draw: function(display, target) {
      var dataItem = target.dataItem;

      var error = dataItem.dataContext.error;

      var yPosition0 = yAxis.valueToPosition(0);
      var yPosition1 = yAxis.valueToPosition(error);

      var height =
        (yAxis.get("renderer").positionToCoordinate(yPosition1) - yAxis.get("renderer").positionToCoordinate(yPosition0)) / 2;

      display.moveTo(0, -height);
      display.lineTo(0, height);

      display.moveTo(-10, -height);
      display.lineTo(10, -height);

      display.moveTo(-10, height);
      display.lineTo(10, height);
    }
  });

  return am5.Bullet.new(root, {
    dynamic: true,
    sprite: graphics
  });
});

// Add circle bullet
// https://www.amcharts.com/docs/v5/charts/xy-chart/series/#Bullets
series.bullets.push(function() {
  var graphics = am5.Circle.new(root, {
    strokeWidth: 2,
    radius: 5,
    stroke: series.get("stroke"),
    fill: root.interfaceColors.get("background")
  });
  return am5.Bullet.new(root, {
    sprite: graphics
  });
});

// Add cursor
// https://www.amcharts.com/docs/v5/charts/xy-chart/cursor/
chart.set("cursor", am5xy.XYCursor.new(root, {
  xAxis: xAxis,
  yAxis: yAxis,
  snapToSeries: [series]
}));

series.data.setAll(data);
xAxis.data.setAll(data);

// Make stuff animate on load
// https://www.amcharts.com/docs/v5/concepts/animations/
series.appear(1000);
chart.appear(1000, 100);

}); // end am5.ready()
</script>

<!-- HTML -->
<div id="chartdiv"></div>