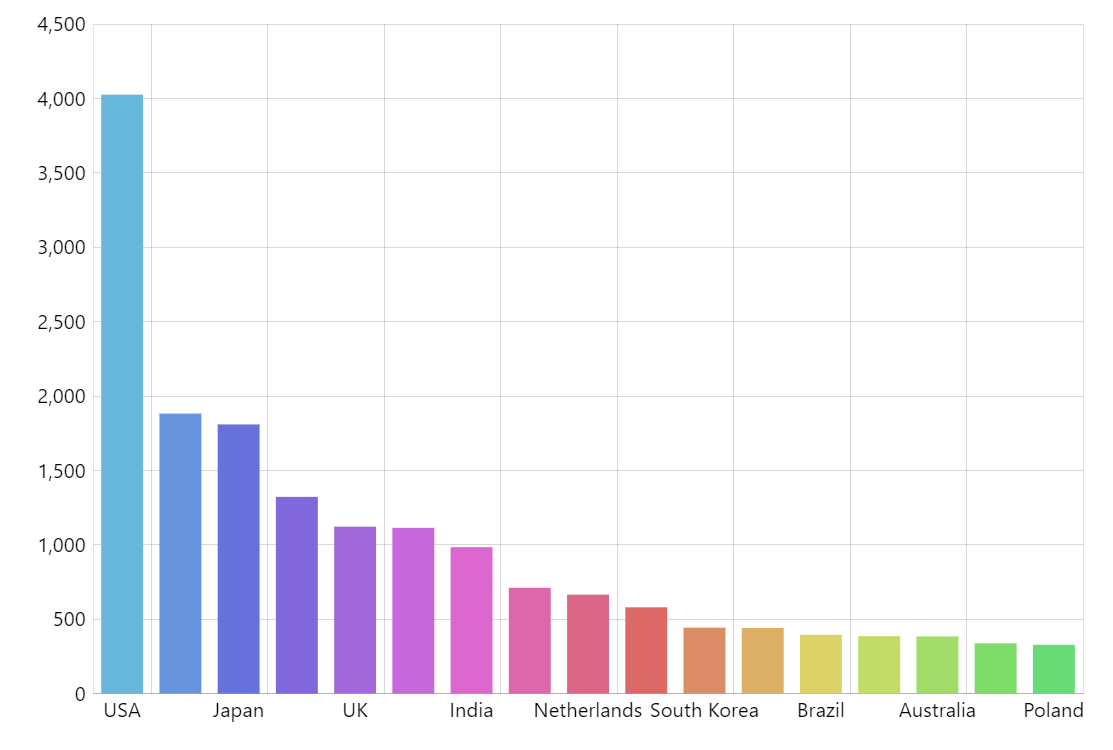
Exporting Chart to Image
Exporting plugin
amCharts 5 comes with a bundled Exporting plugin.
You can export charts to most popular image formats like PNG, JPEG, as well as PDF. Data can be exported as CSV, JSON, or XLSX.
Demo source
<!-- Styles -->
<style>
#chartdiv {
  width: 100%;
  height: 500px;
}
</style>

<!-- Resources -->
<script src="https://cdn.amcharts.com/lib/5/index.js"></script>
<script src="https://cdn.amcharts.com/lib/5/xy.js"></script>
<script src="https://cdn.amcharts.com/lib/5/themes/Animated.js"></script>
<script src="https://cdn.amcharts.com/lib/5/plugins/exporting.js"></script>

<!-- Chart code -->
<script>
am5.ready(function() {

// Create root element
// https://www.amcharts.com/docs/v5/getting-started/#Root_element
var root = am5.Root.new("chartdiv");


// Set themes
// https://www.amcharts.com/docs/v5/concepts/themes/
root.setThemes([
  am5themes_Animated.new(root)
]);


// Create chart
// https://www.amcharts.com/docs/v5/charts/xy-chart/
var chart = root.container.children.push(am5xy.XYChart.new(root, {
  panX: false,
  panY: false,
  wheelX: "panX",
  wheelY: "zoomX",
  layout: root.verticalLayout
}));


var data = [{
  country: "USA",
  visits: 4025,
  columnSettings: {
    fill: chart.get("colors").next()
  }
}, {
  country: "China",
  visits: 1882,
  columnSettings: {
    fill: chart.get("colors").next()
  }
}, {
  country: "Japan",
  visits: 1809,
  columnSettings: {
    fill: chart.get("colors").next()
  }
}, {
  country: "Germany",
  visits: 1322,
  columnSettings: {
    fill: chart.get("colors").next()
  }
}, {
  country: "UK",
  visits: 1122,
  columnSettings: {
    fill: chart.get("colors").next()
  }
}, {
  country: "France",
  visits: 1114,
  columnSettings: {
    fill: chart.get("colors").next()
  }
}, {
  country: "India",
  visits: 984,
  columnSettings: {
    fill: chart.get("colors").next()
  }
}, {
  country: "Spain",
  visits: 711,
  columnSettings: {
    fill: chart.get("colors").next()
  }
}, {
  country: "Netherlands",
  visits: 665,
  columnSettings: {
    fill: chart.get("colors").next()
  }
}, {
  country: "Korea",
  visits: 443,
  columnSettings: {
    fill: chart.get("colors").next()
  }
}, {
  country: "Canada",
  visits: 441,
  columnSettings: {
    fill: chart.get("colors").next()
  }
}, {
  country: "Brazil",
  visits: 395,
  columnSettings: {
    fill: chart.get("colors").next()
  }
}, {
  country: "Italy",
  visits: 386,
  columnSettings: {
    fill: chart.get("colors").next()
  }
}, {
  country: "Australia",
  visits: 384,
  columnSettings: {
    fill: chart.get("colors").next()
  }
}, {
  country: "Taiwan",
  visits: 338,
  columnSettings: {
    fill: chart.get("colors").next()
  }
}, {
  country: "Poland",
  visits: 328,
  columnSettings: {
    fill: chart.get("colors").next()
  }
}]


// Create axes
// https://www.amcharts.com/docs/v5/charts/xy-chart/axes/
var xRenderer = am5xy.AxisRendererX.new(root, {
  cellStartLocation: 0.1,
  cellEndLocation: 0.9,
  minGridDistance: 50
});

var xAxis = chart.xAxes.push(am5xy.CategoryAxis.new(root, {
  categoryField: "country",
  renderer: xRenderer,
  tooltip: am5.Tooltip.new(root, {})
}));

xRenderer.grid.template.setAll({
  location: 1
});

xRenderer.labels.template.setAll({
  multiLocation: 0.5
})

xAxis.data.setAll(data);

var yAxis = chart.yAxes.push(am5xy.ValueAxis.new(root, {
  renderer: am5xy.AxisRendererY.new(root, {
    strokeOpacity: 0.1
  })
}));


// Add series
// https://www.amcharts.com/docs/v5/charts/xy-chart/series/
var series = chart.series.push(am5xy.ColumnSeries.new(root, {
  xAxis: xAxis,
  yAxis: yAxis,
  valueYField: "visits",
  categoryXField: "country"
}));

series.columns.template.setAll({
  tooltipText: "{categoryX}: {valueY}",
  width: am5.percent(90),
  tooltipY: 0,
  strokeOpacity: 0,
  templateField: "columnSettings"
});

series.data.setAll(data);


// Add export menu
var exporting = am5plugins_exporting.Exporting.new(root, {
  menu: am5plugins_exporting.ExportingMenu.new(root, {})
});


// Make stuff animate on load
// https://www.amcharts.com/docs/v5/concepts/animations/
series.appear();
chart.appear(1000, 100);

}); // end am5.ready()
</script>

<!-- HTML -->
<div id="chartdiv"></div>