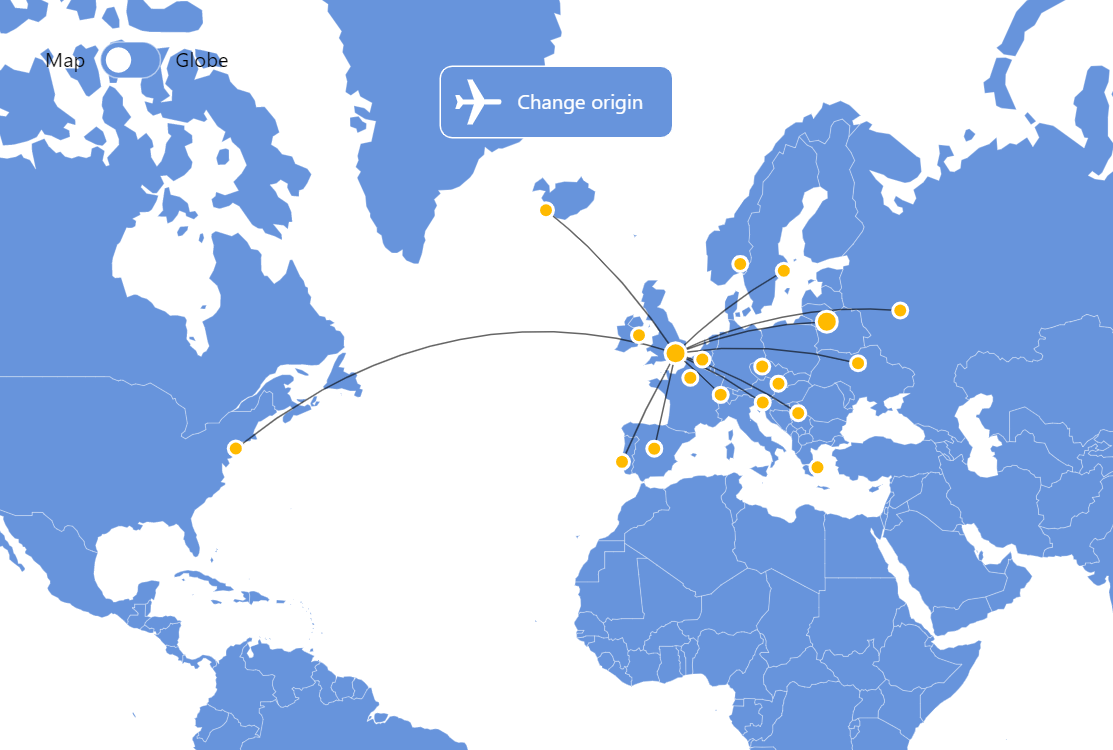
Flight Routes Map
This demo shows how we can use MapChart API to draw map markers and lines using latitude/longitude coordinates.
Related tutorials
Demo source
<!-- Styles -->
<style>
#chartdiv {
  width: 100%;
  height: 600px;
}
</style>

<!-- Resources -->
<script src="https://cdn.amcharts.com/lib/5/index.js"></script>
<script src="https://cdn.amcharts.com/lib/5/map.js"></script>
<script src="https://cdn.amcharts.com/lib/5/geodata/worldLow.js"></script>
<script src="https://cdn.amcharts.com/lib/5/themes/Animated.js"></script>

<!-- Chart code -->
<script>
am5.ready(function() {

// Create root element
// https://www.amcharts.com/docs/v5/getting-started/#Root_element
var root = am5.Root.new("chartdiv");

// Set themes
// https://www.amcharts.com/docs/v5/concepts/themes/
root.setThemes([
  am5themes_Animated.new(root)
]);

// Create the map chart
// https://www.amcharts.com/docs/v5/charts/map-chart/
var chart = root.container.children.push(
  am5map.MapChart.new(root, {
    panX: "translateX",
    panY: "translateY",
    projection: am5map.geoMercator()
  })
);

// Add labels and controls
var cont = chart.children.push(
  am5.Container.new(root, {
    layout: root.horizontalLayout,
    x: 20,
    y: 40
  })
);

cont.children.push(
  am5.Label.new(root, {
    centerY: am5.p50,
    text: "Map"
  })
);

var switchButton = cont.children.push(
  am5.Button.new(root, {
    themeTags: ["switch"],
    centerY: am5.p50,
    icon: am5.Circle.new(root, {
      themeTags: ["icon"]
    })
  })
);

switchButton.on("active", function () {
  if (!switchButton.get("active")) {
    chart.set("projection", am5map.geoMercator());
    chart.set("panX", "translateX");
    chart.set("panY", "translateY");
  } else {
    chart.set("projection", am5map.geoOrthographic());
    chart.set("panX", "rotateX");
    chart.set("panY", "rotateY");
  }
});

cont.children.push(
  am5.Label.new(root, {
    centerY: am5.p50,
    text: "Globe"
  })
);

// Create main polygon series for countries
// https://www.amcharts.com/docs/v5/charts/map-chart/map-polygon-series/
var polygonSeries = chart.series.push(
  am5map.MapPolygonSeries.new(root, {
    geoJSON: am5geodata_worldLow
  })
);

var graticuleSeries = chart.series.push(am5map.GraticuleSeries.new(root, {}));
graticuleSeries.mapLines.template.setAll({
  stroke: root.interfaceColors.get("alternativeBackground"),
  strokeOpacity: 0.08
});

// Create line series for trajectory lines
// https://www.amcharts.com/docs/v5/charts/map-chart/map-line-series/
var lineSeries = chart.series.push(am5map.MapLineSeries.new(root, {}));
lineSeries.mapLines.template.setAll({
  stroke: root.interfaceColors.get("alternativeBackground"),
  strokeOpacity: 0.6
});

// Create point series for markers
// https://www.amcharts.com/docs/v5/charts/map-chart/map-point-series/
var originSeries = chart.series.push(
  am5map.MapPointSeries.new(root, { idField: "id" })
);

originSeries.bullets.push(function () {
  var circle = am5.Circle.new(root, {
    radius: 7,
    tooltipText: "{title} (Click me!)",
    cursorOverStyle: "pointer",
    tooltipY: 0,
    fill: am5.color(0xffba00),
    stroke: root.interfaceColors.get("background"),
    strokeWidth: 2
  });

  circle.events.on("click", function (e) {
    selectOrigin(e.target.dataItem.get("id"));
  });
  return am5.Bullet.new(root, {
    sprite: circle
  });
});

// destination series
var destinationSeries = chart.series.push(am5map.MapPointSeries.new(root, {}));

destinationSeries.bullets.push(function () {
  var circle = am5.Circle.new(root, {
    radius: 5,
    tooltipText: "{title}",
    tooltipY: 0,
    fill: am5.color(0xffba00),
    stroke: root.interfaceColors.get("background"),
    strokeWidth: 2
  });

  return am5.Bullet.new(root, {
    sprite: circle
  });
});

var button = root.container.children.push(
  am5.Button.new(root, {
    x: am5.p50,
    y: 60,
    centerX: am5.p50,
    label: am5.Label.new(root, {
      text: "Change origin",
      centerY: am5.p50
    }),
    icon: am5.Graphics.new(root, {
      svgPath: "m2,106h28l24,30h72l-44,-133h35l80,132h98c21,0 21,34 0,34l-98,0 -80,134h-35l43,-133h-71l-24,30h-28l15,-47",
      scale: 0.1,
      centerY: am5.p50,
      centerX: am5.p50,
      fill: am5.color(0xffffff)
    })
  })
);

button.events.on("click", function () {
  if (currentId == "vilnius") {
    selectOrigin("london");
  } else {
    selectOrigin("vilnius");
  }
});

var originCities = [
  {
    id: "london",
    title: "London",
    destinations: [
      "vilnius",
      "reykjavik",
      "lisbon",
      "moscow",
      "belgrade",
      "ljublana",
      "madrid",
      "stockholm",
      "bern",
      "kiev",
      "new york"
    ],
    geometry: { type: "Point", coordinates: [-0.1262, 51.5002] },
    zoomLevel: 2.74,
    zoomPoint: { longitude: -20.1341, latitude: 49.1712 }
  },
  {
    id: "vilnius",
    title: "Vilnius",
    destinations: [
      "london",
      "brussels",
      "prague",
      "athens",
      "dublin",
      "oslo",
      "moscow",
      "bratislava",
      "belgrade",
      "madrid"
    ],
    geometry: { type: "Point", coordinates: [25.2799, 54.6896] },
    zoomLevel: 4.92,
    zoomPoint: { longitude: 15.4492, latitude: 50.2631 }
  }
];

var destinationCities = [
  {
    id: "brussels",
    title: "Brussels",
    geometry: { type: "Point", coordinates: [4.3676, 50.8371] }
  },
  {
    id: "prague",
    title: "Prague",
    geometry: { type: "Point", coordinates: [14.4205, 50.0878] }
  },
  {
    id: "athens",
    title: "Athens",
    geometry: { type: "Point", coordinates: [23.7166, 37.9792] }
  },
  {
    id: "reykjavik",
    title: "Reykjavik",
    geometry: { type: "Point", coordinates: [-21.8952, 64.1353] }
  },
  {
    id: "dublin",
    title: "Dublin",
    geometry: { type: "Point", coordinates: [-6.2675, 53.3441] }
  },
  {
    id: "oslo",
    title: "Oslo",
    geometry: { type: "Point", coordinates: [10.7387, 59.9138] }
  },
  {
    id: "lisbon",
    title: "Lisbon",
    geometry: { type: "Point", coordinates: [-9.1355, 38.7072] }
  },
  {
    id: "moscow",
    title: "Moscow",
    geometry: { type: "Point", coordinates: [37.6176, 55.7558] }
  },
  {
    id: "belgrade",
    title: "Belgrade",
    geometry: { type: "Point", coordinates: [20.4781, 44.8048] }
  },
  {
    id: "bratislava",
    title: "Bratislava",
    geometry: { type: "Point", coordinates: [17.1547, 48.2116] }
  },
  {
    id: "ljublana",
    title: "Ljubljana",
    geometry: { type: "Point", coordinates: [14.506, 46.0514] }
  },
  {
    id: "madrid",
    title: "Madrid",
    geometry: { type: "Point", coordinates: [-3.7033, 40.4167] }
  },
  {
    id: "stockholm",
    title: "Stockholm",
    geometry: { type: "Point", coordinates: [18.0645, 59.3328] }
  },
  {
    id: "bern",
    title: "Bern",
    geometry: { type: "Point", coordinates: [7.4481, 46.948] }
  },
  {
    id: "kiev",
    title: "Kiev",
    geometry: { type: "Point", coordinates: [30.5367, 50.4422] }
  },
  {
    id: "paris",
    title: "Paris",
    geometry: { type: "Point", coordinates: [2.351, 48.8567] }
  },
  {
    id: "new york",
    title: "New York",
    geometry: { type: "Point", coordinates: [-74, 40.43] }
  }
];

originSeries.data.setAll(originCities);
destinationSeries.data.setAll(destinationCities);

function selectOrigin(id) {
  currentId = id;
  var dataItem = originSeries.getDataItemById(id);
  var dataContext = dataItem.dataContext;
  chart.zoomToGeoPoint(dataContext.zoomPoint, dataContext.zoomLevel, true);

  var destinations = dataContext.destinations;
  var lineSeriesData = [];
  var originLongitude = dataItem.get("longitude");
  var originLatitude = dataItem.get("latitude");

  am5.array.each(destinations, function (did) {
    var destinationDataItem = destinationSeries.getDataItemById(did);
    if (!destinationDataItem) {
      destinationDataItem = originSeries.getDataItemById(did);
    }
    lineSeriesData.push({
      geometry: {
        type: "LineString",
        coordinates: [
          [originLongitude, originLatitude],
          [
            destinationDataItem.get("longitude"),
            destinationDataItem.get("latitude")
          ]
        ]
      }
    });
  });
  lineSeries.data.setAll(lineSeriesData);
}

var currentId = "london";

destinationSeries.events.on("datavalidated", function () {
  selectOrigin(currentId);
});

// Make stuff animate on load
chart.appear(1000, 100);

}); // end am5.ready()
</script>

<!-- HTML -->
<div id="chartdiv"></div>