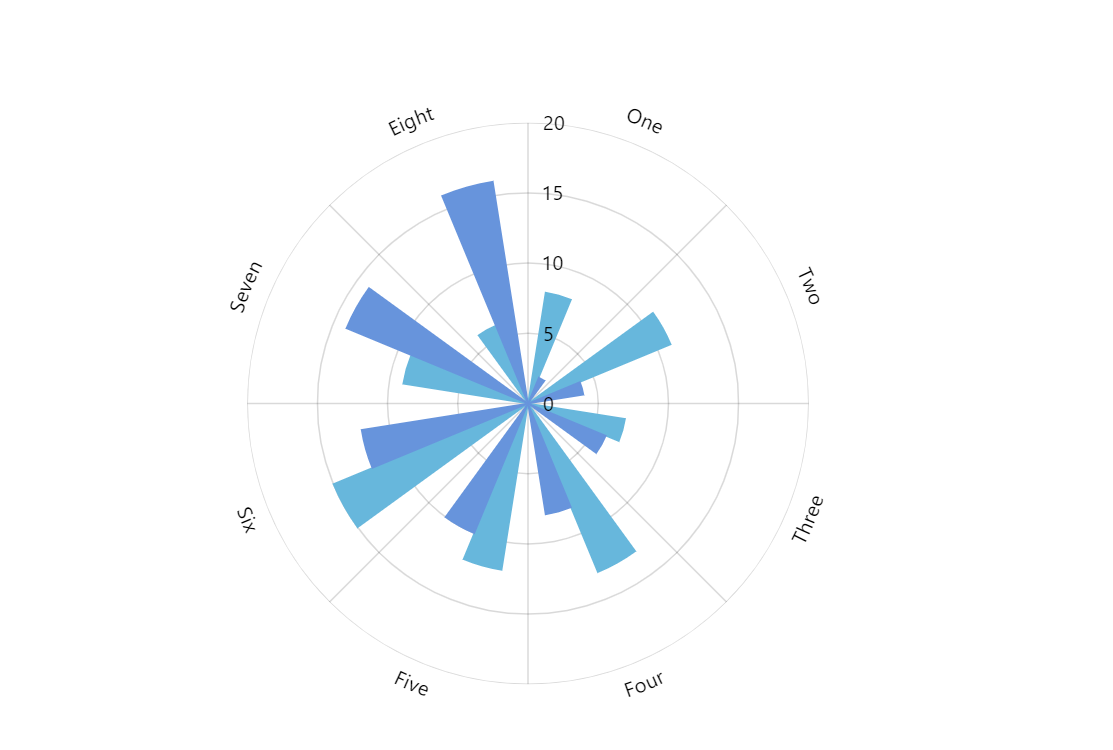
Flower Chart
Flower chart, also known as filled radar chart.
Key implementation details
We create the Flower chart by adding a RadarColumnSeries to the radar chart. We set cellStartLocation and cellEndLocation on the category axis renderer so that the columns fill the central part of each cell and not side-to-side.
Related tutorials
Demo source
<!-- Styles -->
<style>
#chartdiv {
  width: 100%;
  height: 600px;
}
</style>

<!-- Resources -->
<script src="https://cdn.amcharts.com/lib/5/index.js"></script>
<script src="https://cdn.amcharts.com/lib/5/xy.js"></script>
<script src="https://cdn.amcharts.com/lib/5/radar.js"></script>
<script src="https://cdn.amcharts.com/lib/5/themes/Animated.js"></script>

<!-- Chart code -->
<script>
am5.ready(function() {

// Create root element
// https://www.amcharts.com/docs/v5/getting-started/#Root_element
var root = am5.Root.new("chartdiv");

// Set themes
// https://www.amcharts.com/docs/v5/concepts/themes/
root.setThemes([
  am5themes_Animated.new(root)
]);

// Data
// https://www.amcharts.com/docs/v5/charts/radar-chart/#Setting_data
var data = [{
  category: "One",
  value1: 8,
  value2: 2
}, {
  category: "Two",
  value1: 11,
  value2: 4
}, {
  category: "Three",
  value1: 7,
  value2: 6
}, {
  category: "Four",
  value1: 13,
  value2: 8
}, {
  category: "Five",
  value1: 12,
  value2: 10
}, {
  category: "Six",
  value1: 15,
  value2: 12
}, {
  category: "Seven",
  value1: 9,
  value2: 14
}, {
  category: "Eight",
  value1: 6,
  value2: 16
}];

// Create chart
// https://www.amcharts.com/docs/v5/charts/radar-chart/
var chart = root.container.children.push(
  am5radar.RadarChart.new(root, {
    panX: false,
    panY: false,
    wheelX: "panX",
    wheelY: "zoomX"
  })
);

// Add cursor
// https://www.amcharts.com/docs/v5/charts/radar-chart/#Cursor
var cursor = chart.set("cursor", am5radar.RadarCursor.new(root, {
  behavior: "zoomX"
}));

cursor.lineY.set("visible", false);

// Create axes and their renderers
// https://www.amcharts.com/docs/v5/charts/radar-chart/#Adding_axes
var xRenderer = am5radar.AxisRendererCircular.new(root, {
  cellStartLocation: 0.2,
  cellEndLocation: 0.8
});

xRenderer.labels.template.setAll({
  radius: 10
});

var xAxis = chart.xAxes.push(
  am5xy.CategoryAxis.new(root, {
    maxDeviation: 0,
    categoryField: "category",
    renderer: xRenderer,
    tooltip: am5.Tooltip.new(root, {})
  })
);

xAxis.data.setAll(data);

var yAxis = chart.yAxes.push(
  am5xy.ValueAxis.new(root, {
    renderer: am5radar.AxisRendererRadial.new(root, {})
  })
);

// Create series
// https://www.amcharts.com/docs/v5/charts/radar-chart/#Adding_series
for (var i = 1; i <= 2; i++) {
  var series = chart.series.push(
    am5radar.RadarColumnSeries.new(root, {
      name: "Series " + i,
      xAxis: xAxis,
      yAxis: yAxis,
      valueYField: "value" + i,
      categoryXField: "category"
    })
  );

  series.columns.template.setAll({
    tooltipText: "{name}: {valueY}",
    width: am5.percent(100)
  });

  series.data.setAll(data);

  series.appear(1000);
}

// Add scrollbars
chart.set("scrollbarX", am5.Scrollbar.new(root, { orientation: "horizontal", exportable: false }));
chart.set("scrollbarY", am5.Scrollbar.new(root, { orientation: "vertical", exportable: false }));


// Animate chart
// https://www.amcharts.com/docs/v5/concepts/animations/#Initial_animation
chart.appear(1000, 100);

}); // end am5.ready()
</script>

<!-- HTML -->
<div id="chartdiv"></div>