Force-Directed Adding Links
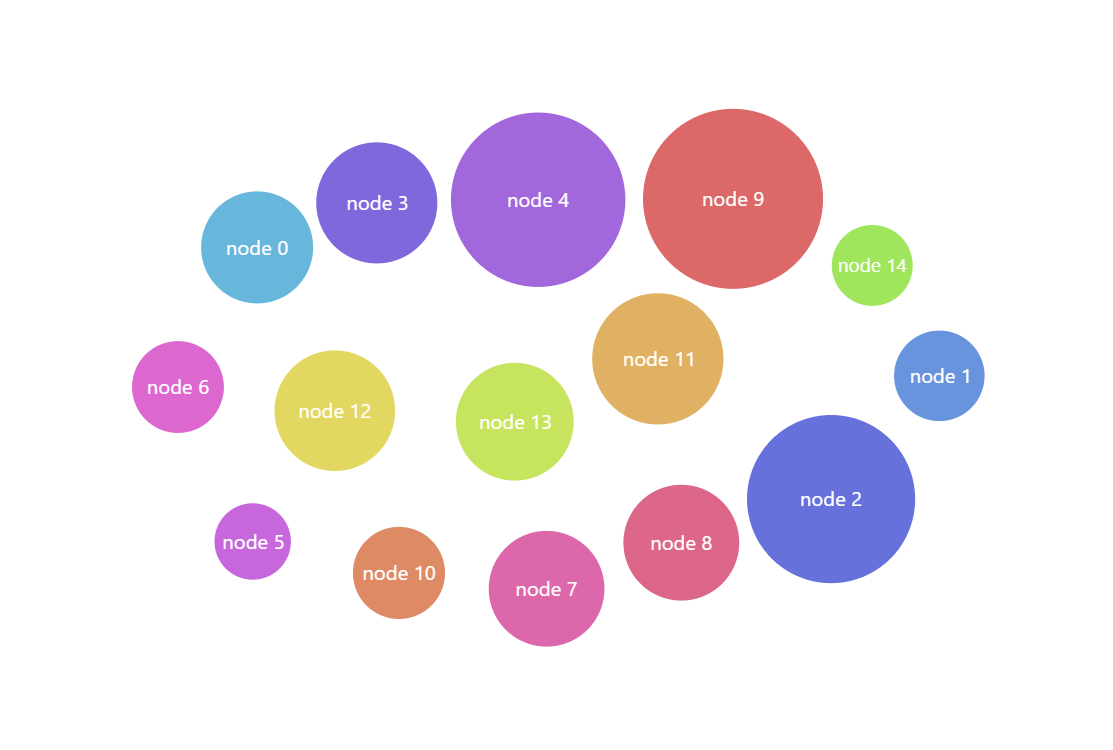
Not only can you use amCharts 5 to create amazing force-directed network visuals but you can also use the library as a UI to let users set those links in an engaging visual manner. Try clicking on a node and then click other nodes to link with it.
Key implementation details
We add an event handler for the click event on our nodes. In the handler we select or deselect a node and visually mark it by enabling an outer circle on the selected node. If a node is already selected and some different node is clicked we link or unlink the nodes by calling linkDataItems() or unlinkDataItems() methods of the ForceDirected series.
Related tutorials
Demo source
<!-- Styles -->
<style>
#chartdiv {
  width: 100%;
  height: 550px;
}
</style>

<!-- Resources -->
<script src="https://cdn.amcharts.com/lib/5/index.js"></script>
<script src="https://cdn.amcharts.com/lib/5/hierarchy.js"></script>
<script src="https://cdn.amcharts.com/lib/5/themes/Animated.js"></script>

<!-- Chart code -->
<script>
am5.ready(function() {

// Create root element
// https://www.amcharts.com/docs/v5/getting-started/#Root_element
var root = am5.Root.new("chartdiv");

// Set themes
// https://www.amcharts.com/docs/v5/concepts/themes/
root.setThemes([
  am5themes_Animated.new(root)
]);

var data = {
  value: 0,
  children: []
}

for (var i = 0; i < 15; i++) {
  data.children.push({ name: "node " + i, value: Math.random() * 20 + 1 })
}

// Create wrapper container
var container = root.container.children.push(
  am5.Container.new(root, {
    width: am5.percent(100),
    height: am5.percent(100),
    layout: root.verticalLayout
  })
);

// Create series
// https://www.amcharts.com/docs/v5/charts/hierarchy/#Adding
var series = container.children.push(
  am5hierarchy.ForceDirected.new(root, {
    singleBranchOnly: false,
    downDepth: 2,
    topDepth: 1,
    initialDepth: 1,
    maxRadius: 60,
    minRadius: 20,
    valueField: "value",
    categoryField: "name",
    childDataField: "children",
    manyBodyStrength: -13,
    centerStrength: 0.8
  })
);

series.get("colors").setAll({
  step: 1
});

series.links.template.setAll({
  strokeWidth: 2
});

series.nodes.template.setAll({
  tooltipText: null,
  cursorOverStyle: "pointer"
});

var selectedDataItem;

// handle clicking on nodes and link/unlink them
series.nodes.template.events.on("click", function(e) {
  // check if we have a selected data item
  if (selectedDataItem) {
    var targetDataItem = e.target.dataItem;
    // if yes, and it's the same, unselect
    if (e.target.dataItem == selectedDataItem) {
      selectedDataItem.get("outerCircle").setPrivate("visible", false);
      selectedDataItem = undefined;
    }
    // otherwise connect selected with a clicked point
    else {
      if (series.areLinked(selectedDataItem, targetDataItem)) {
        series.unlinkDataItems(selectedDataItem, targetDataItem);
      }
      else {
        series.linkDataItems(selectedDataItem, targetDataItem, 0.2);
      }
    }
  }
  // if no selected data item, select
  else {
    selectedDataItem = e.target.dataItem;
    selectedDataItem.get("outerCircle").setPrivate("visible", true)
  }
})

series.data.setAll([data]);
series.set("selectedDataItem", series.dataItems[0]);

// Make stuff animate on load
series.appear(1000, 100);

}); // end am5.ready()
</script>

<!-- HTML -->
<div id="chartdiv"></div>