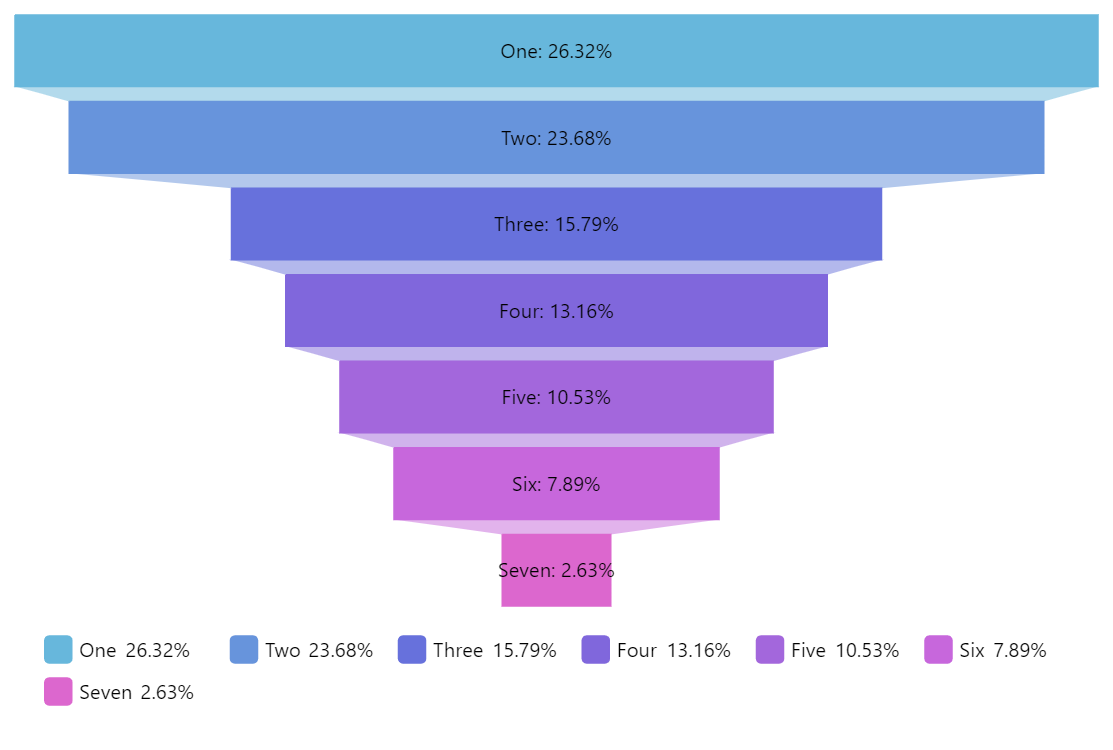
Funnel Chart
Funnel Chart is used to display how the data is filtered down through the steps of some process or processes. Each step represents a portion of the total going through it. The top (head) of each step represents the incoming value and the bottom (neck) the output value after some sort of filtering.
Related tutorials
Demo source
<!-- Styles -->
<style>
#chartdiv {
  width: 100%;
  height: 500px;
}
</style>

<!-- Resources -->
<script src="https://cdn.amcharts.com/lib/5/index.js"></script>
<script src="https://cdn.amcharts.com/lib/5/percent.js"></script>
<script src="https://cdn.amcharts.com/lib/5/themes/Animated.js"></script>

<!-- Chart code -->
<script>
am5.ready(function() {

// Create root element
// https://www.amcharts.com/docs/v5/getting-started/#Root_element
var root = am5.Root.new("chartdiv");


// Set themes
// https://www.amcharts.com/docs/v5/concepts/themes/
root.setThemes([
  am5themes_Animated.new(root)
]);


// Create chart
// https://www.amcharts.com/docs/v5/charts/percent-charts/sliced-chart/
var chart = root.container.children.push(am5percent.SlicedChart.new(root, {
  layout: root.verticalLayout
}));


// Create series
// https://www.amcharts.com/docs/v5/charts/percent-charts/sliced-chart/#Series
var series = chart.series.push(am5percent.FunnelSeries.new(root, {
  alignLabels: false,
  orientation: "vertical",
  valueField: "value",
  categoryField: "category"
}));


// Set data
// https://www.amcharts.com/docs/v5/charts/percent-charts/sliced-chart/#Setting_data
series.data.setAll([
  { value: 10, category: "One" },
  { value: 9, category: "Two" },
  { value: 6, category: "Three" },
  { value: 5, category: "Four" },
  { value: 4, category: "Five" },
  { value: 3, category: "Six" },
  { value: 1, category: "Seven" }
]);


// Play initial series animation
// https://www.amcharts.com/docs/v5/concepts/animations/#Animation_of_series
series.appear();


// Create legend
// https://www.amcharts.com/docs/v5/charts/percent-charts/legend-percent-series/
var legend = chart.children.push(am5.Legend.new(root, {
  centerX: am5.p50,
  x: am5.p50,
  marginTop: 15,
  marginBottom: 15
}));

legend.data.setAll(series.dataItems);


// Make stuff animate on load
// https://www.amcharts.com/docs/v5/concepts/animations/
chart.appear(1000, 100);

}); // end am5.ready()
</script>

<!-- HTML -->
<div id="chartdiv"></div>