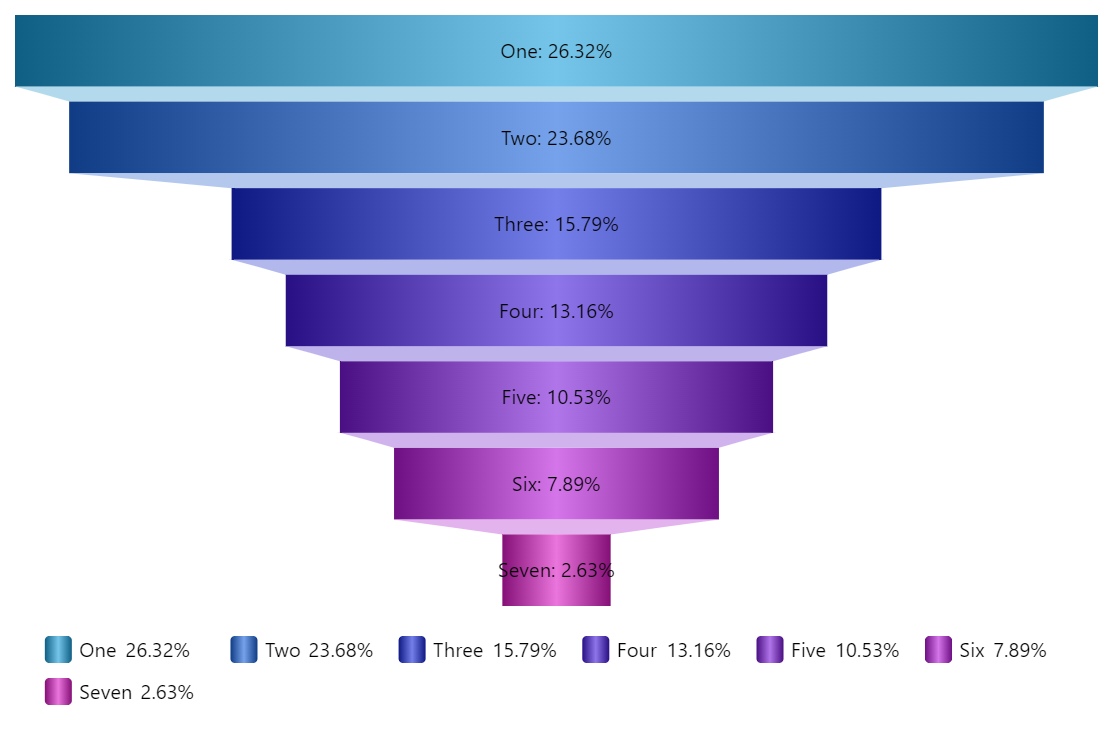
Funnel with Gradient Fill
Gradients can enhance the visual appeal of chart and even create a faux 3D feel when needed. amCharts has the helpers to create advanced gradients.
Key implementation details
In this demo we set fillGradient on our Funnels slices template to a LinearGradient. The gradient has 3 stops with adjusted brightness creating the effect you see.
Related tutorials
Demo source
<!-- Styles -->
<style>
#chartdiv {
  width: 100%;
  height: 500px;
}
</style>

<!-- Resources -->
<script src="https://cdn.amcharts.com/lib/5/index.js"></script>
<script src="https://cdn.amcharts.com/lib/5/percent.js"></script>
<script src="https://cdn.amcharts.com/lib/5/themes/Animated.js"></script>

<!-- Chart code -->
<script>
am5.ready(function() {

// Create root element
// https://www.amcharts.com/docs/v5/getting-started/#Root_element
var root = am5.Root.new("chartdiv");

// Set themes
// https://www.amcharts.com/docs/v5/concepts/themes/
root.setThemes([am5themes_Animated.new(root)]);

// Create chart
// https://www.amcharts.com/docs/v5/charts/percent-charts/sliced-chart/
var chart = root.container.children.push(
  am5percent.SlicedChart.new(root, {
    layout: root.verticalLayout
  })
);

// Create series
// https://www.amcharts.com/docs/v5/charts/percent-charts/sliced-chart/#Series
var series = chart.series.push(
  am5percent.FunnelSeries.new(root, {
    alignLabels: false,
    orientation: "vertical",
    valueField: "value",
    categoryField: "category"
  })
);

// make fills gradients
series.slices.template.setAll({
  strokeOpacity: 0,
  fillGradient: am5.LinearGradient.new(root, {
    rotation: 0,
    stops: [{ brighten: -0.4 }, { brighten: 0.4 }, { brighten: -0.4 }]
  })
});

// Set data
// https://www.amcharts.com/docs/v5/charts/percent-charts/sliced-chart/#Setting_data
series.data.setAll([
  { value: 10, category: "One" },
  { value: 9, category: "Two" },
  { value: 6, category: "Three" },
  { value: 5, category: "Four" },
  { value: 4, category: "Five" },
  { value: 3, category: "Six" },
  { value: 1, category: "Seven" }
]);

// Play initial series animation
// https://www.amcharts.com/docs/v5/concepts/animations/#Animation_of_series
series.appear();

// Create legend
// https://www.amcharts.com/docs/v5/charts/percent-charts/legend-percent-series/
var legend = chart.children.push(
  am5.Legend.new(root, {
    centerX: am5.p50,
    x: am5.p50,
    marginTop: 15,
    marginBottom: 15
  })
);

legend.data.setAll(series.dataItems);

// Make stuff animate on load
// https://www.amcharts.com/docs/v5/concepts/animations/
chart.appear(1000, 100);

}); // end am5.ready()
</script>

<!-- HTML -->
<div id="chartdiv"></div>