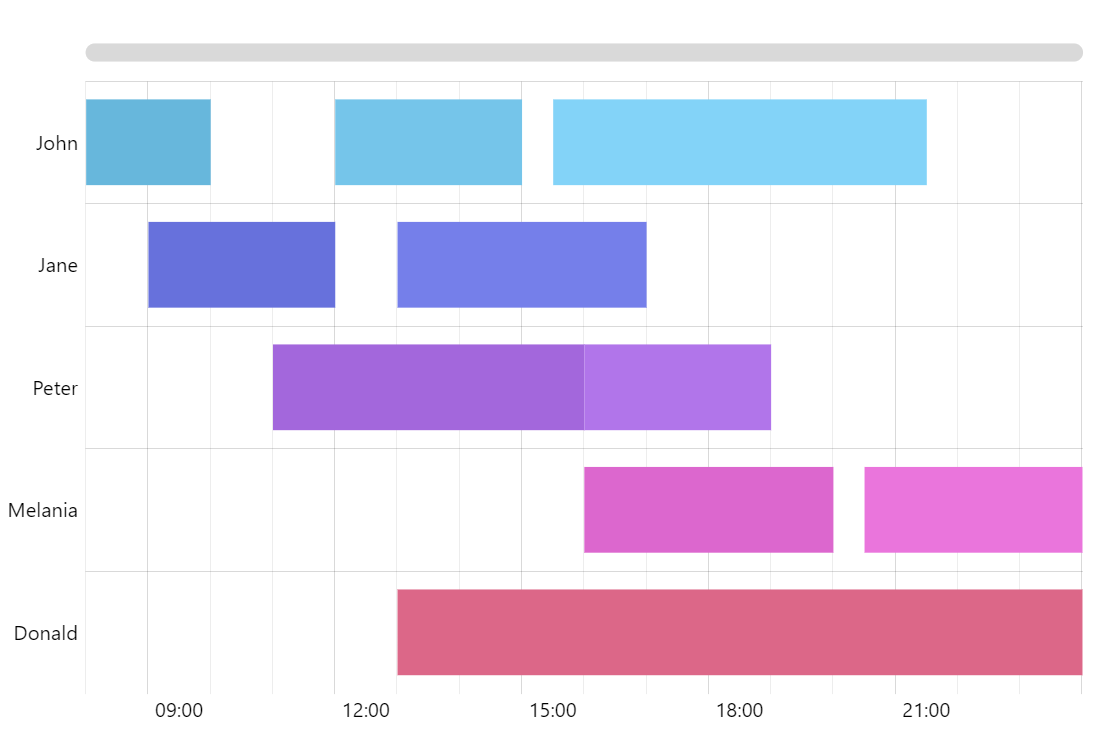
Gantt Chart
Gantt charts are typically used to display schedules or other time-based activities. In a nutshell, Gantt chart is a variation of a bar chart with time-based horizontal axis and bars starting at arbitrary values rather than on the axis.
Key implementation details
The only change needed to convert a regular bar chart with time-based values to a Gantt chart is changing its start values so bars don’t sart on the category axis, but rather on a specific value. We achieve this by setting openValueXField on the ColumnSeries.
Related tutorials
Demo source
<!-- Styles -->
<style>
#chartdiv {
  width: 100%;
  height: 500px;
}
</style>

<!-- Resources -->
<script src="https://cdn.amcharts.com/lib/5/index.js"></script>
<script src="https://cdn.amcharts.com/lib/5/xy.js"></script>
<script src="https://cdn.amcharts.com/lib/5/themes/Animated.js"></script>

<!-- Chart code -->
<script>
am5.ready(function() {


// Create root element
// https://www.amcharts.com/docs/v5/getting-started/#Root_element
var root = am5.Root.new("chartdiv");
root.dateFormatter.setAll({
  dateFormat: "yyyy-MM-dd HH:mm",
  dateFields: ["valueX", "openValueX"]
});


// Set themes
// https://www.amcharts.com/docs/v5/concepts/themes/
root.setThemes([
  am5themes_Animated.new(root)
]);


// Create chart
// https://www.amcharts.com/docs/v5/charts/xy-chart/
var chart = root.container.children.push(am5xy.XYChart.new(root, {
  panX: false,
  panY: false,
  wheelX: "panX",
  wheelY: "zoomX",
  layout: root.verticalLayout,
  paddingLeft: 0
}));


// Add legend
// https://www.amcharts.com/docs/v5/charts/xy-chart/legend-xy-series/
var legend = chart.children.push(am5.Legend.new(root, {
  centerX: am5.p50,
  x: am5.p50
}))

var colors = chart.get("colors");

// Data
var data = [
  {
    category: "John",
    fromDate: "2018-01-01 08:00",
    toDate: "2018-01-01 10:00",
    columnSettings: {
      fill: am5.Color.brighten(colors.getIndex(0), 0)
    }
  },
  {
    category: "John",
    fromDate: "2018-01-01 12:00",
    toDate: "2018-01-01 15:00",
    columnSettings: {
      fill: am5.Color.brighten(colors.getIndex(0), 0.4)
    }
  },
  {
    category: "John",
    fromDate: "2018-01-01 15:30",
    toDate: "2018-01-01 21:30",
    columnSettings: {
      fill: am5.Color.brighten(colors.getIndex(0), 0.8)
    }
  },

  {
    category: "Jane",
    fromDate: "2018-01-01 09:00",
    toDate: "2018-01-01 12:00",
    columnSettings: {
      fill: am5.Color.brighten(colors.getIndex(2), 0)
    }
  },
  {
    category: "Jane",
    fromDate: "2018-01-01 13:00",
    toDate: "2018-01-01 17:00",
    columnSettings: {
      fill: am5.Color.brighten(colors.getIndex(2), 0.4)
    }
  },

  {
    category: "Peter",
    fromDate: "2018-01-01 11:00",
    toDate: "2018-01-01 16:00",
    columnSettings: {
      fill: am5.Color.brighten(colors.getIndex(4), 0)
    }
  },
  {
    category: "Peter",
    fromDate: "2018-01-01 16:00",
    toDate: "2018-01-01 19:00",
    columnSettings: {
      fill: am5.Color.brighten(colors.getIndex(4), 0.4)
    }
  },

  {
    category: "Melania",
    fromDate: "2018-01-01 16:00",
    toDate: "2018-01-01 20:00",
    columnSettings: {
      fill: am5.Color.brighten(colors.getIndex(6), 0)
    }
  },
  {
    category: "Melania",
    fromDate: "2018-01-01 20:30",
    toDate: "2018-01-02 00:00",
    columnSettings: {
      fill: am5.Color.brighten(colors.getIndex(6), 0.4)
    }
  },

  {
    category: "Donald",
    fromDate: "2018-01-01 13:00",
    toDate: "2018-01-02 00:00",
    columnSettings: {
      fill: am5.Color.brighten(colors.getIndex(8), 0)
    }
  }
];


// Create axes
// https://www.amcharts.com/docs/v5/charts/xy-chart/axes/
var yAxis = chart.yAxes.push(
  am5xy.CategoryAxis.new(root, {
    categoryField: "category",
    renderer: am5xy.AxisRendererY.new(root, {
      inversed: true,
      minorGridEnabled: true
    }),
    tooltip: am5.Tooltip.new(root, {
      themeTags: ["axis"],
      animationDuration: 200
    })
  })
);

yAxis.data.setAll([
  { category: "John" },
  { category: "Jane" },
  { category: "Peter" },
  { category: "Melania" },
  { category: "Donald" }
]);

var xAxis = chart.xAxes.push(
  am5xy.DateAxis.new(root, {
    baseInterval: { timeUnit: "minute", count: 1 },
    renderer: am5xy.AxisRendererX.new(root, {
      minorGridEnabled: true,
      minGridDistance: 90
    })
  })
);


// Add series
// https://www.amcharts.com/docs/v5/charts/xy-chart/series/
var series = chart.series.push(am5xy.ColumnSeries.new(root, {
  xAxis: xAxis,
  yAxis: yAxis,
  openValueXField: "fromDate",
  valueXField: "toDate",
  categoryYField: "category",
  sequencedInterpolation: true
}));

series.columns.template.setAll({
  templateField: "columnSettings",
  strokeOpacity: 0,
  tooltipText: "{category}: {openValueX} - {valueX}"
});

series.data.processor = am5.DataProcessor.new(root, {
  dateFields: ["fromDate", "toDate"],
  dateFormat: "yyyy-MM-dd HH:mm"
});
series.data.setAll(data);

// Add scrollbars
chart.set("scrollbarX", am5.Scrollbar.new(root, {
  orientation: "horizontal"
}));

// Make stuff animate on load
// https://www.amcharts.com/docs/v5/concepts/animations/
series.appear();
chart.appear(1000, 100);

}); // end am5.ready()
</script>

<!-- HTML -->
<div id="chartdiv"></div>