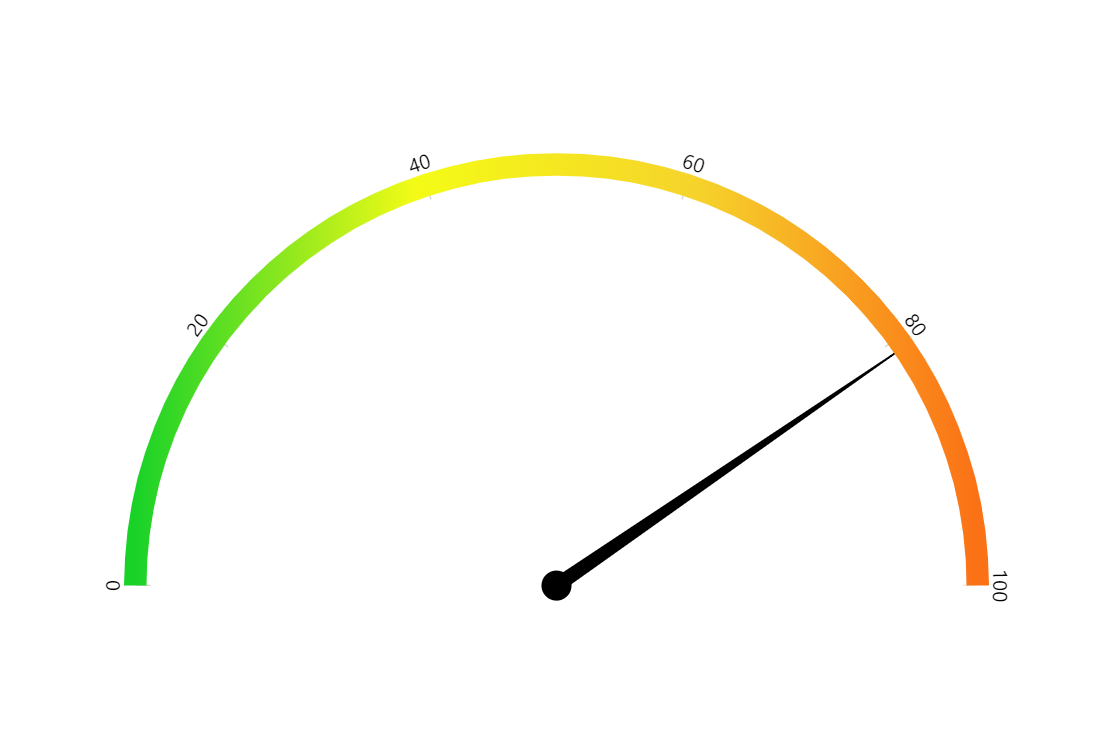
Gauge with Gradient Fill
It is very common for physical gauges to have a scale from safe to dangerous values, for example. This scale is usually accompanied with a gradient color band going from green to red. You can easily achieve the same with amCharts Gauge Chart.
Key implementation details
We create the gradient fill by configuring the axis renderer for our value axis. We use a circular axis renderer (AxisRendererCircular) for that and set its strokeGradient to a LinearGradient. Stroke width of 15 creates the feeling of a “fill”.
Related tutorials
Demo source
<!-- Styles -->
<style>
#chartdiv {
  width: 100%;
  height: 500px;
}
</style>

<!-- Resources -->
<script src="https://cdn.amcharts.com/lib/5/index.js"></script>
<script src="https://cdn.amcharts.com/lib/5/xy.js"></script>
<script src="https://cdn.amcharts.com/lib/5/radar.js"></script>
<script src="https://cdn.amcharts.com/lib/5/themes/Animated.js"></script>

<!-- Chart code -->
<script>
am5.ready(function() {

// Create root element
// https://www.amcharts.com/docs/v5/getting-started/#Root_element
var root = am5.Root.new("chartdiv");

// Set themes
// https://www.amcharts.com/docs/v5/concepts/themes/
root.setThemes([
  am5themes_Animated.new(root)
]);

// Create chart
// https://www.amcharts.com/docs/v5/charts/radar-chart/
var chart = root.container.children.push(
  am5radar.RadarChart.new(root, {
    panX: false,
    panY: false,
    startAngle: 180,
    endAngle: 360
  })
);

// Create axis and its renderer
// https://www.amcharts.com/docs/v5/charts/radar-chart/gauge-charts/#Axes
var axisRenderer = am5radar.AxisRendererCircular.new(root, {
  innerRadius: -10,
  strokeOpacity: 1,
  strokeWidth: 15,
  strokeGradient: am5.LinearGradient.new(root, {
    rotation: 0,
    stops: [
      { color: am5.color(0x19d228) },
      { color: am5.color(0xf4fb16) },
      { color: am5.color(0xf6d32b) },
      { color: am5.color(0xfb7116) }
    ]
  })
});

var xAxis = chart.xAxes.push(
  am5xy.ValueAxis.new(root, {
    maxDeviation: 0,
    min: 0,
    max: 100,
    strictMinMax: true,
    renderer: axisRenderer
  })
);

// Add clock hand
// https://www.amcharts.com/docs/v5/charts/radar-chart/gauge-charts/#Clock_hands
var axisDataItem = xAxis.makeDataItem({});
axisDataItem.set("value", 0);

var bullet = axisDataItem.set("bullet", am5xy.AxisBullet.new(root, {
  sprite: am5radar.ClockHand.new(root, {
    radius: am5.percent(99)
  })
}));

xAxis.createAxisRange(axisDataItem);

axisDataItem.get("grid").set("visible", false);

setInterval(() => {
  axisDataItem.animate({
    key: "value",
    to: Math.round(Math.random() * 100),
    duration: 800,
    easing: am5.ease.out(am5.ease.cubic)
  });
}, 2000);

// Make stuff animate on load
chart.appear(1000, 100);

}); // end am5.ready()
</script>

<!-- HTML -->
<div id="chartdiv"></div>