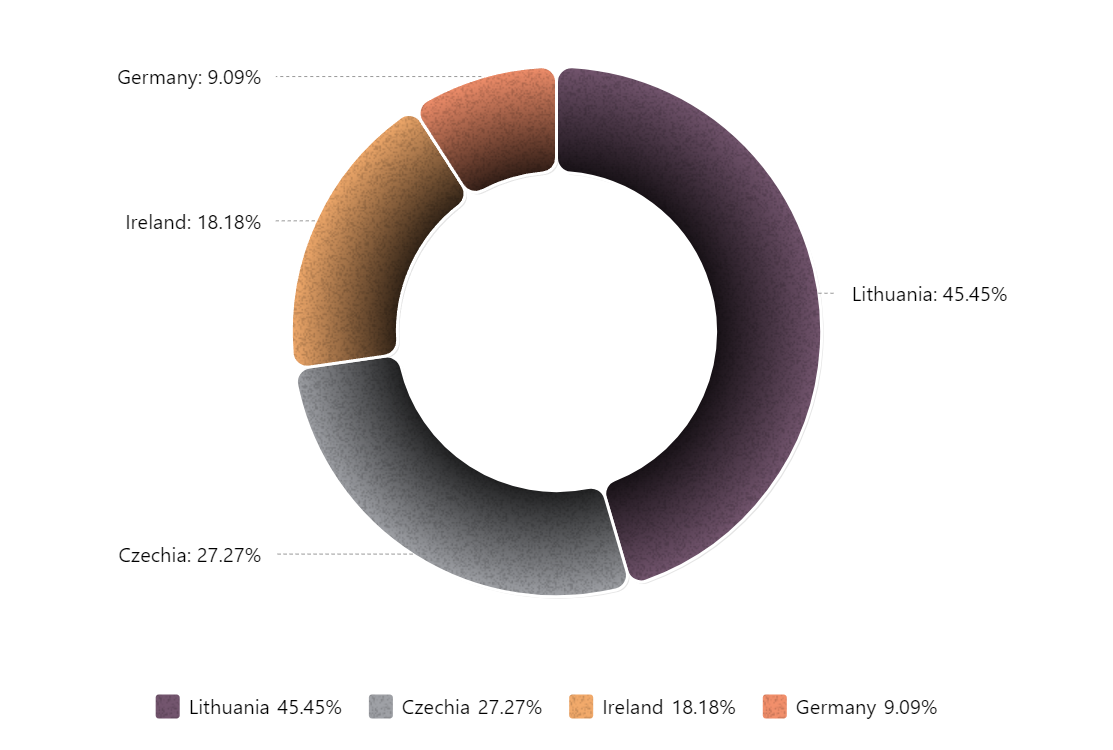
Grainy Gradient Pie
You can fill any graphics object with grain (noise) pattern. Grain pattern is a special kind of pattern that can complement regular fills with overhead pixel noise to add that additional fuzzy look. It works by applying a random assortment of semi-transparent dots over existing fills.
Related tutorials
Demo source
<!-- Styles -->
<style>
#chartdiv {
  width: 100%;
  max-width:100%;
  height: 500px;
}
</style>

<!-- Resources -->
<script src="https://cdn.amcharts.com/lib/5/index.js"></script>
<script src="https://cdn.amcharts.com/lib/5/percent.js"></script>
<script src="https://cdn.amcharts.com/lib/5/themes/Animated.js"></script>

<!-- Chart code -->
<script>
am5.ready(function() {

// Create root element
// https://www.amcharts.com/docs/v5/getting-started/#Root_element
var root = am5.Root.new("chartdiv");

// Set themes
// https://www.amcharts.com/docs/v5/concepts/themes/
root.setThemes([
  am5themes_Animated.new(root)
]);


// Create chart
// https://www.amcharts.com/docs/v5/charts/percent-charts/pie-chart/
var chart = root.container.children.push(
  am5percent.PieChart.new(root, {
    endAngle: 270,
    layout:root.verticalLayout,
    innerRadius: am5.percent(60)
  })
);
/*
var bg = root.container.set("background", am5.Rectangle.new(root, {
  fillPattern: am5.GrainPattern.new(root, {
    density: 0.1,
    maxOpacity: 0.2
  })
}))

*/

// Create series
// https://www.amcharts.com/docs/v5/charts/percent-charts/pie-chart/#Series
var series = chart.series.push(
  am5percent.PieSeries.new(root, {
    valueField: "value",
    categoryField: "category",
    endAngle: 270
  })
);

series.set("colors", am5.ColorSet.new(root, {
  colors: [
    am5.color(0x73556E),
    am5.color(0x9FA1A6),
    am5.color(0xF2AA6B),
    am5.color(0xF28F6B),
    am5.color(0xA95A52),
    am5.color(0xE35B5D),
    am5.color(0xFFA446)
  ]
}))

var gradient = am5.RadialGradient.new(root, {
  stops: [
    { color: am5.color(0x000000) },
    { color: am5.color(0x000000) },
    {}
  ]
})

series.slices.template.setAll({
  fillGradient: gradient,
  strokeWidth: 2,
  stroke: am5.color(0xffffff),
  cornerRadius: 10,
  shadowOpacity: 0.1,
  shadowOffsetX: 2,
  shadowOffsetY: 2,
  shadowColor: am5.color(0x000000),
  fillPattern: am5.GrainPattern.new(root, {
    maxOpacity: 0.2,
    density: 0.5,
    colors: [am5.color(0x000000)]
  })
})

series.slices.template.states.create("hover", {
  shadowOpacity: 1,
  shadowBlur: 10
})

series.ticks.template.setAll({
   strokeOpacity:0.4,
strokeDasharray:[2,2]
})

series.states.create("hidden", {
  endAngle: -90
});

// Set data
// https://www.amcharts.com/docs/v5/charts/percent-charts/pie-chart/#Setting_data
series.data.setAll([{
  category: "Lithuania",
  value: 500
}, {
  category: "Czechia",
  value: 300
}, {
  category: "Ireland",
  value: 200
}, {
  category: "Germany",
  value: 100
}]);

var legend = chart.children.push(am5.Legend.new(root, {
  centerX: am5.percent(50),
  x: am5.percent(50),
  marginTop: 15,
  marginBottom: 15,
}));
legend.markerRectangles.template.adapters.add("fillGradient", function() {
  return undefined;
})
legend.data.setAll(series.dataItems);

series.appear(1000, 100);

}); // end am5.ready()
</script>

<!-- HTML -->
<div id="chartdiv"></div>