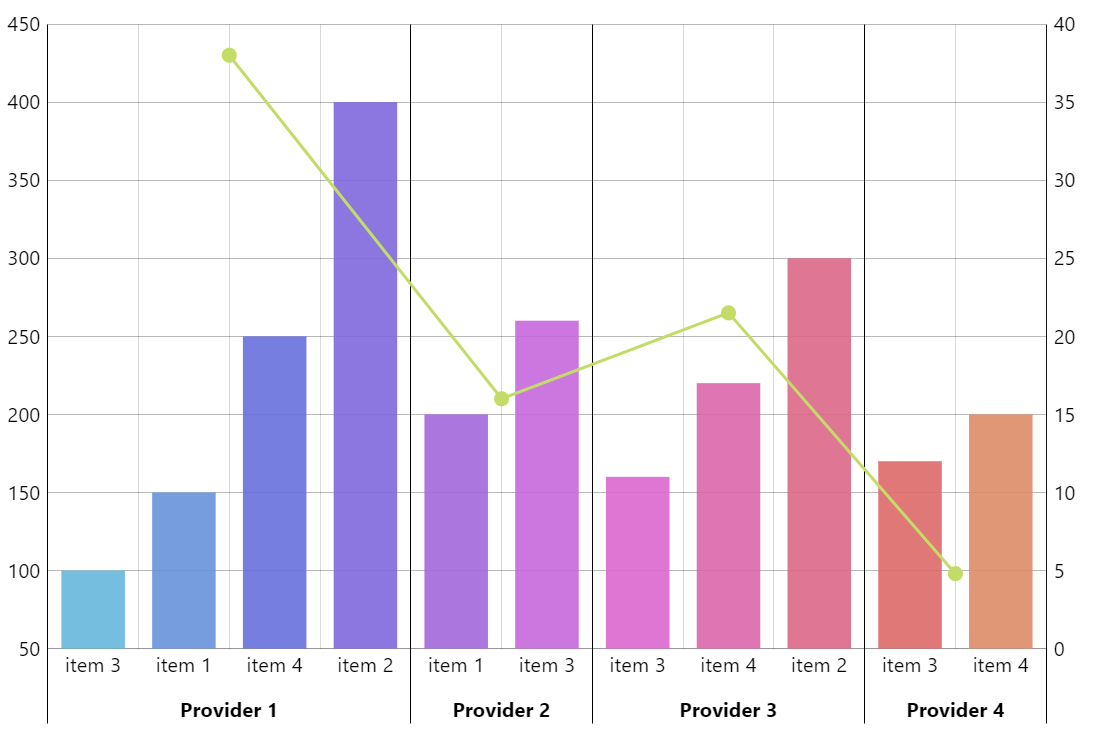
Grouped and Sorted Columns
amCharts libraries are flexible in a way that even when something is not a special feature in the library, you can still easily implement it with amCharts. In this case we have a 2-level deep dataset but we want to represent it as a column chart you see here – no problem with amCharts 5!
Key implementation details
To achieve the result we “flatten” the data set into a flat array, sort it and use the axis ranges feature to create these visual groups.
Related tutorials
Demo source
<!-- Styles -->
<style>
#chartdiv {
  width: 100%;
  height: 500px;
}
</style>

<!-- Resources -->
<script src="https://cdn.amcharts.com/lib/5/index.js"></script>
<script src="https://cdn.amcharts.com/lib/5/xy.js"></script>
<script src="https://cdn.amcharts.com/lib/5/themes/Animated.js"></script>

<!-- Chart code -->
<script>
am5.ready(function() {

// Create root element
// https://www.amcharts.com/docs/v5/getting-started/#Root_element
var root = am5.Root.new("chartdiv");

// Set themes
// https://www.amcharts.com/docs/v5/concepts/themes/
root.setThemes([
  am5themes_Animated.new(root)
]);

// Create chart
// https://www.amcharts.com/docs/v5/charts/xy-chart/
var chart = root.container.children.push(
  am5xy.XYChart.new(root, {
    panX: false,
    panY: false,
    wheelX: "none",
    wheelY: "none",
    paddingLeft: 0
  })
);

// Add cursor
// https://www.amcharts.com/docs/v5/charts/xy-chart/cursor/
var cursor = chart.set("cursor", am5xy.XYCursor.new(root, {}));
cursor.lineY.set("visible", false);

// Create axes
// https://www.amcharts.com/docs/v5/charts/xy-chart/axes/
var xRenderer = am5xy.AxisRendererX.new(root, {
  minGridDistance: 30,
  minorGridEnabled:true
});

xRenderer.labels.template.setAll({ text: "{realName}" });

var xAxis = chart.xAxes.push(
  am5xy.CategoryAxis.new(root, {
    maxDeviation: 0,
    categoryField: "category",
    renderer: xRenderer,
    tooltip: am5.Tooltip.new(root, {
      labelText: "{realName}"
    })
  })
);

var yAxis = chart.yAxes.push(
  am5xy.ValueAxis.new(root, {
    maxDeviation: 0.3,
    renderer: am5xy.AxisRendererY.new(root, {})
  })
);

var yAxis2 = chart.yAxes.push(
  am5xy.ValueAxis.new(root, {
    maxDeviation: 0.3,
    syncWithAxis: yAxis,
    renderer: am5xy.AxisRendererY.new(root, { opposite: true })
  })
);

// Create series
// https://www.amcharts.com/docs/v5/charts/xy-chart/series/
var series = chart.series.push(
  am5xy.ColumnSeries.new(root, {
    name: "Series 1",
    xAxis: xAxis,
    yAxis: yAxis2,
    valueYField: "value",
    sequencedInterpolation: true,
    categoryXField: "category",
    tooltip: am5.Tooltip.new(root, {
      labelText: "{provider} {realName}: {valueY}"
    })
  })
);

series.columns.template.setAll({
  fillOpacity: 0.9,
  strokeOpacity: 0
});
series.columns.template.adapters.add("fill", (fill, target) => {
  return chart.get("colors").getIndex(series.columns.indexOf(target));
});

series.columns.template.adapters.add("stroke", (stroke, target) => {
  return chart.get("colors").getIndex(series.columns.indexOf(target));
});

var lineSeries = chart.series.push(
  am5xy.LineSeries.new(root, {
    name: "Series 2",
    xAxis: xAxis,
    yAxis: yAxis,
    valueYField: "quantity",
    sequencedInterpolation: true,
    stroke: chart.get("colors").getIndex(13),
    fill: chart.get("colors").getIndex(13),
    categoryXField: "category",
    tooltip: am5.Tooltip.new(root, {
      labelText: "{valueY}"
    })
  })
);

lineSeries.strokes.template.set("strokeWidth", 2);

lineSeries.bullets.push(function () {
  return am5.Bullet.new(root, {
    locationY: 1,
    locationX: undefined,
    sprite: am5.Circle.new(root, {
      radius: 5,
      fill: lineSeries.get("fill")
    })
  });
});

// when data validated, adjust location of data item based on count
lineSeries.events.on("datavalidated", function () {
  am5.array.each(lineSeries.dataItems, function (dataItem) {
    // if count divides by two, location is 0 (on the grid)
    if (
      dataItem.dataContext.count / 2 ==
      Math.round(dataItem.dataContext.count / 2)
    ) {
      dataItem.set("locationX", 0);
    }
    // otherwise location is 0.5 (middle)
    else {
      dataItem.set("locationX", 0.5);
    }
  });
});

var chartData = [];

// Set data
var data = {
  "Provider 1": {
    "item 1": 10,
    "item 2": 35,
    "item 3": 5,
    "item 4": 20,
    quantity: 430
  },
  "Provider 2": {
    "item 1": 15,
    "item 3": 21,
    quantity: 210
  },
  "Provider 3": {
    "item 2": 25,
    "item 3": 11,
    "item 4": 17,
    quantity: 265
  },
  "Provider 4": {
    "item 3": 12,
    "item 4": 15,
    quantity: 98
  }
};

// process data ant prepare it for the chart
for (var providerName in data) {
  var providerData = data[providerName];

  // add data of one provider to temp array
  var tempArray = [];
  var count = 0;
  // add items
  for (var itemName in providerData) {
    if (itemName != "quantity") {
      count++;
      // we generate unique category for each column (providerName + "_" + itemName) and store realName
      tempArray.push({
        category: providerName + "_" + itemName,
        realName: itemName,
        value: providerData[itemName],
        provider: providerName
      });
    }
  }
  // sort temp array
  tempArray.sort(function (a, b) {
    if (a.value > b.value) {
      return 1;
    } else if (a.value < b.value) {
      return -1;
    } else {
      return 0;
    }
  });

  // add quantity and count to middle data item (line series uses it)
  var lineSeriesDataIndex = Math.floor(count / 2);
  tempArray[lineSeriesDataIndex].quantity = providerData.quantity;
  tempArray[lineSeriesDataIndex].count = count;
  // push to the final data
  am5.array.each(tempArray, function (item) {
    chartData.push(item);
  });

  // create range (the additional label at the bottom)

  var range = xAxis.makeDataItem({});
  xAxis.createAxisRange(range);

  range.set("category", tempArray[0].category);
  range.set("endCategory", tempArray[tempArray.length - 1].category);

  var label = range.get("label");

  label.setAll({
    text: tempArray[0].provider,
    dy: 30,
    fontWeight: "bold",
    tooltipText: tempArray[0].provider
  });

  var tick = range.get("tick");
  tick.setAll({ visible: true, strokeOpacity: 1, length: 50, location: 0 });

  var grid = range.get("grid");
  grid.setAll({ strokeOpacity: 1 });
}

// add range for the last grid
var range = xAxis.makeDataItem({});
xAxis.createAxisRange(range);
range.set("category", chartData[chartData.length - 1].category);
var tick = range.get("tick");
tick.setAll({ visible: true, strokeOpacity: 1, length: 50, location: 1 });

var grid = range.get("grid");
grid.setAll({ strokeOpacity: 1, location: 1 });

xAxis.data.setAll(chartData);
series.data.setAll(chartData);
lineSeries.data.setAll(chartData);

// Make stuff animate on load
// https://www.amcharts.com/docs/v5/concepts/animations/
series.appear(1000);
chart.appear(1000, 100);

}); // end am5.ready()
</script>

<!-- HTML -->
<div id="chartdiv"></div>