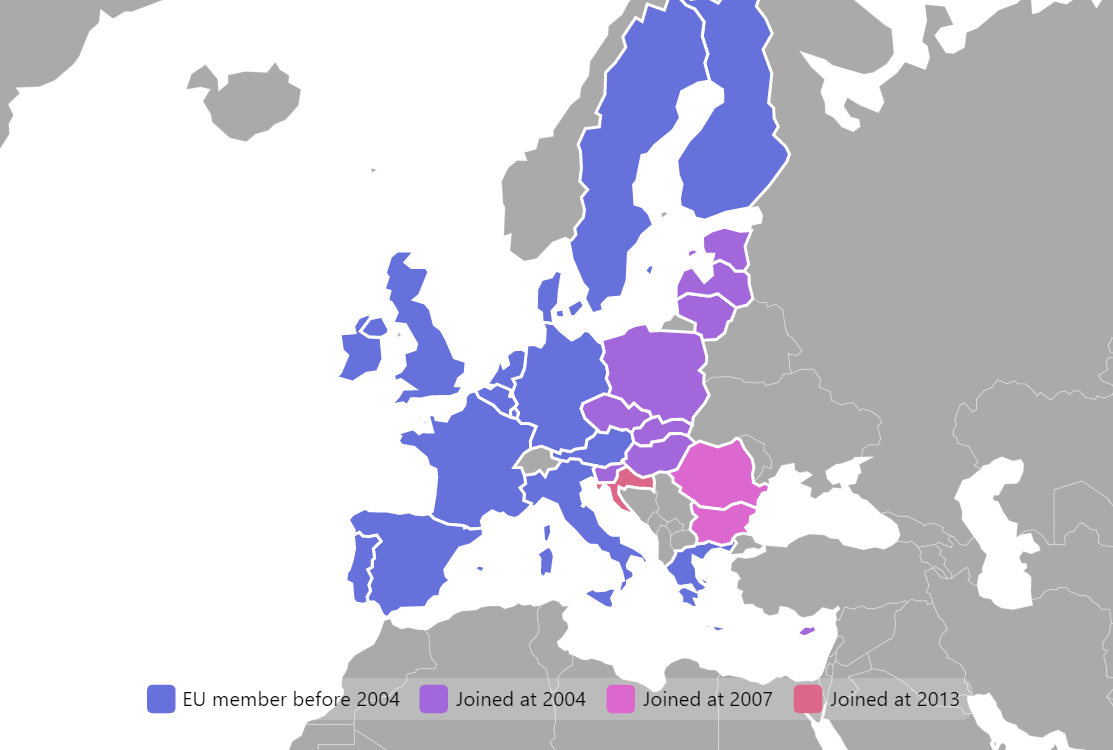
Grouped Countries Map
Sometimes you need to group countries on a map based on some criteria. In the most simple case you can just set the same fill color for countries in a group. But in this demo we go a step further and make all countries in a group react to pointer events jointly and also create a legend that switches the whole group off and back on.
Key implementation details
We create a separate MapPolygonSeries for each country group on the map. For each pointerover and pointerout event on an individual country, we switch the state on all countries in the group. Finally, we add our map polygon series as data items of the Legend.
Related tutorials
Demo source
<!-- Styles -->
<style>
#chartdiv {
  width: 100%;
  height: 500px;
}
</style>

<!-- Resources -->
<script src="https://cdn.amcharts.com/lib/5/index.js"></script>
<script src="https://cdn.amcharts.com/lib/5/map.js"></script>
<script src="https://cdn.amcharts.com/lib/5/geodata/worldLow.js"></script>
<script src="https://cdn.amcharts.com/lib/5/themes/Animated.js"></script>

<!-- Chart code -->
<script>
am5.ready(function() {

// Data
var groupData = [
  {
    "name": "EU member before 2004",
    "data": [
      { "id": "AT", "joined": "1995"},
      { "id": "IE", "joined": "1973"},
      { "id": "DK", "joined": "1973"},
      { "id": "FI", "joined": "1995"},
      { "id": "SE", "joined": "1995"},
      { "id": "GB", "joined": "1973"},
      { "id": "IT", "joined": "1957"},
      { "id": "FR", "joined": "1957"},
      { "id": "ES", "joined": "1986"},
      { "id": "GR", "joined": "1981"},
      { "id": "DE", "joined": "1957"},
      { "id": "BE", "joined": "1957"},
      { "id": "LU", "joined": "1957"},
      { "id": "NL", "joined": "1957"},
      { "id": "PT", "joined": "1986"}
   ]
  }, {
    "name": "Joined at 2004",
    "data": [
      { "id": "LT", "joined": "2004" },
      { "id": "LV", "joined": "2004" },
      { "id": "CZ", "joined": "2004" },
      { "id": "SK", "joined": "2004" },
      { "id": "SI", "joined": "2004" },
      { "id": "EE", "joined": "2004" },
      { "id": "HU", "joined": "2004" },
      { "id": "CY", "joined": "2004" },
      { "id": "MT", "joined": "2004" },
      { "id": "PL", "joined": "2004" }
    ]
  }, {
    "name": "Joined at 2007",
    "data": [
      { "id": "RO", "joined": "2007" },
      { "id": "BG", "joined": "2007" }
    ]
  }, {
    "name": "Joined at 2013",
    "data": [
      { "id": "HR", "joined": "2013" }
    ]
  }
];


// Create root and chart
var root = am5.Root.new("chartdiv");


// Set themes
root.setThemes([
  am5themes_Animated.new(root)
]);


// Create chart
var chart = root.container.children.push(am5map.MapChart.new(root, {
  homeZoomLevel: 3.5,
  homeGeoPoint: { longitude: 10, latitude: 52 }
}));


// Create world polygon series
var worldSeries = chart.series.push(am5map.MapPolygonSeries.new(root, {
  geoJSON: am5geodata_worldLow,
  exclude: ["AQ"]
}));

worldSeries.mapPolygons.template.setAll({
  fill: am5.color(0xaaaaaa)
});

worldSeries.events.on("datavalidated", () => {
  chart.goHome();
});


// Add legend
var legend = chart.children.push(am5.Legend.new(root, {
  useDefaultMarker: true,
  centerX: am5.p50,
  x: am5.p50,
  centerY: am5.p100,
  y: am5.p100,
  dy: -20,
  background: am5.RoundedRectangle.new(root, {
    fill: am5.color(0xffffff),
    fillOpacity: 0.2
  })
}));

legend.valueLabels.template.set("forceHidden", true)


// Create series for each group
var colors = am5.ColorSet.new(root, {
  step: 2
});
colors.next();

am5.array.each(groupData, function(group) {
  var countries = [];
  var color = colors.next();

  am5.array.each(group.data, function(country) {
    countries.push(country.id)
  });

  var polygonSeries = chart.series.push(am5map.MapPolygonSeries.new(root, {
    geoJSON: am5geodata_worldLow,
    include: countries,
    name: group.name,
    fill: color
  }));


  polygonSeries.mapPolygons.template.setAll({
    tooltipText: "[bold]{name}[/]\nMember since {joined}",
    interactive: true,
    fill: color,
    strokeWidth: 2
  });

  polygonSeries.mapPolygons.template.states.create("hover", {
    fill: am5.Color.brighten(color, -0.3)
  });

  polygonSeries.mapPolygons.template.events.on("pointerover", function(ev) {
    ev.target.series.mapPolygons.each(function(polygon) {
      polygon.states.applyAnimate("hover");
    });
  });

  polygonSeries.mapPolygons.template.events.on("pointerout", function(ev) {
    ev.target.series.mapPolygons.each(function(polygon) {
      polygon.states.applyAnimate("default");
    });
  });
  polygonSeries.data.setAll(group.data);

  legend.data.push(polygonSeries);
});

}); // end am5.ready()
</script>

<!-- HTML -->
<div id="chartdiv"></div>