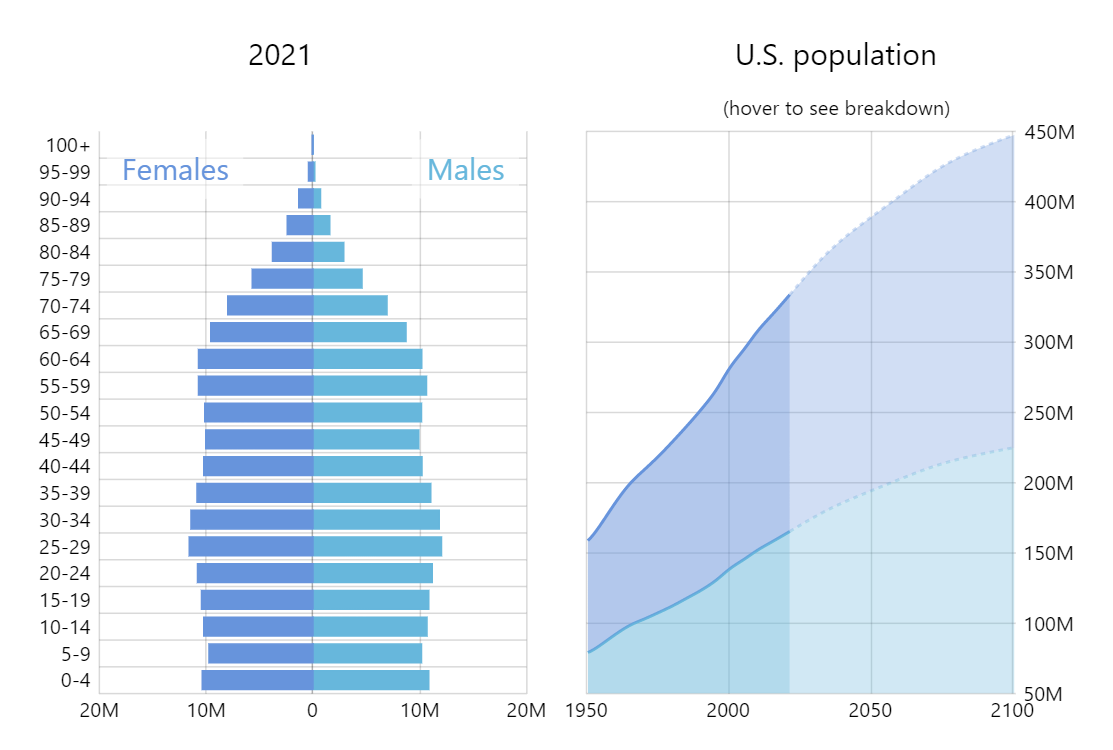
Historical Population Pyramid
A population pyramid, also called an “age-sex-pyramid” or “mirror bar chart”, is a graphical illustration that shows the distribution of various age groups in a population.
By combining and linking the pyramid with a stacked area chart we are able to create a compact and interactive visualization covering a lot of historical date.
Related tutorials
Demo source
<!-- Styles -->
<style>
#chartdiv {
  width: 100%;
  height: 500px;
}
</style>

<!-- Resources -->
<script src="https://cdn.amcharts.com/lib/5/index.js"></script>
<script src="https://cdn.amcharts.com/lib/5/xy.js"></script>
<script src="https://cdn.amcharts.com/lib/5/themes/Animated.js"></script>

<!-- Chart code -->
<script>
am5.ready(function() {

// Create root element
// https://www.amcharts.com/docs/v5/getting-started/#Root_element
var root = am5.Root.new("chartdiv");

// Set themes
// https://www.amcharts.com/docs/v5/concepts/themes/
root.setThemes([
  am5themes_Animated.new(root)
]);

root.numberFormatter.setAll({
  numberFormat: "#,###.#as",
  bigNumberPrefixes: [
    { "number": 1e+3, "suffix": "M" }
  ]
});

// Create wrapper for charts
var container = root.container.children.push(am5.Container.new(root, {
  width: am5.p100,
  height: am5.p100,
  layout: root.horizontalLayout
}));

// ==========================================
// Load data
// ==========================================

// Init data storage
var currentYear = new Date().getFullYear().toString();
var sourceData = [];

// Load pyramid data
am5.net.load("https://s3-us-west-2.amazonaws.com/s.cdpn.io/t-160/un_population_age_groups.csv").then(function(result) {

  // Parse data
  var data = am5.CSVParser.parse(result.response, {
    skipEmpty: true
  });

  // Process data
  var processor = am5.DataProcessor.new(root, {
    dateFields: ["col3"],
    dateFormat: "yyyy",
    numericFields: ["col5", "col6", "col7"]
  });
  processor.processMany(data);

  sourceData = data;

  // Update current data
  var currentData = getCurrentData();

  pyramidYAxis.data.setAll(currentData);
  pyramidSeriesMale.data.setAll(currentData);
  pyramidSeriesFemale.data.setAll(currentData);

});

// Load population data
am5.net.load("https://s3-us-west-2.amazonaws.com/s.cdpn.io/t-160/un_population.csv").then(function(result) {

  // Parse data
  var data = am5.CSVParser.parse(result.response, {
    skipEmpty: true
  });

  // Process data
  var processor = am5.DataProcessor.new(root, {
    dateFields: ["col3"],
    dateFormat: "yyyy",
    numericFields: ["col4", "col5", "col6"]
  });
  processor.processMany(data);

  am5.array.each(data, function(item) {
    if (new Date(item.col3).getFullYear() == currentYear) {
      item.lineSettings = {
        strokeDasharray: [3, 3],
        strokeOpacity: 0.3,
        fillOpacity: 0.3
      };
    }
  });

  popSeriesMale.data.setAll(data);
  popSeriesFemale.data.setAll(data);
});

function getCurrentData() {
  var currentData = [];
  am5.array.each(sourceData, function(row, i) {
    var year = new Date(row.col3).getFullYear();
    if (year == currentYear) {
      if (row.col6 > 0) {
        row.col6 *= -1;
      }
      currentData.push(row);
    }
  });
  currentData.sort(function(a, b) {
    var a1 = Number(a.col4.replace(/[^0-9]+.*$/, ""));
    var b1 = Number(b.col4.replace(/[^0-9]+.*$/, ""));
    if (a1 > b1) {
      return 1;
    }
    else if (a1 < b1) {
      return -1;
    }
    return 0;
  });
  return currentData;
}

function updateData() {
  var data = getCurrentData();
  var pyramidData = pyramidSeriesMale.data.values;

  if (data.length == 0) {
    return;
  }
  am5.array.each(pyramidData, function(row, i) {
    var row = JSON.parse(JSON.stringify(pyramidData[i]));
    if (!data[i]) {
      row.col5 = 0;
      row.col6 = 0;
    }
    else {
      row.col5 = data[i].col5;
      row.col6 = data[i].col6;
    }
    pyramidSeriesMale.data.setIndex(i, row);
    pyramidSeriesFemale.data.setIndex(i, row);
  });

  // Set title
  pyramidTitle.set("text", currentYear + "");
}


// ==========================================
// Pyramid chart
// ==========================================

// Create chart
// https://www.amcharts.com/docs/v5/charts/xy-chart/
var pyramidChart = container.children.push(
  am5xy.XYChart.new(root, {
    width: am5.p50,
    panX: false,
    panY: false,
    wheelX: "none",
    wheelY: "none",
    layout: root.verticalLayout
  })
);

// Add titles
var pyramidSubtitle = pyramidChart.children.unshift(am5.Label.new(root, {
  text: " ",
  x: am5.p50,
  centerX: am5.p50
}));

var pyramidTitle = pyramidChart.children.unshift(am5.Label.new(root, {
  text: currentYear + "",
  fontSize: 20,
  x: am5.p50,
  centerX: am5.p50
}));

// Add labels
var maleLabel = pyramidChart.plotContainer.children.push(am5.Label.new(root, {
  text: "Males",
  fontSize: 20,
  x: am5.p100,
  y: 5,
  centerX: am5.p100,
  dx: -5,
  fill: pyramidChart.get("colors").getIndex(0),
  background: am5.RoundedRectangle.new(root, {
    fill: am5.color(0xffffff),
    fillOpacity: 0.5
  })
}));

var femaleLabel = pyramidChart.plotContainer.children.push(am5.Label.new(root, {
  text: "Females",
  fontSize: 20,
  y: 5,
  x: 5,
  fill: pyramidChart.get("colors").getIndex(1),
  background: am5.RoundedRectangle.new(root, {
    fill: am5.color(0xffffff),
    fillOpacity: 0.5
  })
}));

// Create axes
// https://www.amcharts.com/docs/v5/charts/xy-chart/axes/
var pyramidXAxis = pyramidChart.xAxes.push(
  am5xy.ValueAxis.new(root, {
    min: -20000,
    max: 20000,
    renderer: am5xy.AxisRendererX.new(root, {
      minGridDistance: 50,
      strokeOpacity: 0.1
    }),
    tooltip: am5.Tooltip.new(root, {})
  })
);

var yRenderer = am5xy.AxisRendererY.new(root, {
  minGridDistance: 10,
  minorGridEnabled: true
})
var pyramidYAxis = pyramidChart.yAxes.push(
  am5xy.CategoryAxis.new(root, {
    categoryField: "col4",
    renderer: yRenderer
  })
);

yRenderer.grid.template.setAll({
  location: 1
})

// Add series
// https://www.amcharts.com/docs/v5/charts/xy-chart/series/
var pyramidSeriesMale = pyramidChart.series.push(
  am5xy.ColumnSeries.new(root, {
    xAxis: pyramidXAxis,
    yAxis: pyramidYAxis,
    categoryYField: "col4",
    valueXField: "col5",
    clustered: false,
    tooltip: am5.Tooltip.new(root, {
      labelText: "{valueX}"
    })
  })
);

var pyramidSeriesFemale = pyramidChart.series.push(
  am5xy.ColumnSeries.new(root, {
    xAxis: pyramidXAxis,
    yAxis: pyramidYAxis,
    categoryYField: "col4",
    valueXField: "col6",
    clustered: false,
    tooltip: am5.Tooltip.new(root, {
      labelText: "{valueX}"
    })
  })
);

// Add cursor
// https://www.amcharts.com/docs/v5/charts/xy-chart/cursor/
var pyradmidCursor = pyramidChart.set("cursor", am5xy.XYCursor.new(root, {
  xAxis: pyramidXAxis,
  yAxis: pyramidYAxis
}));
pyradmidCursor.lineX.set("visible", false);
pyradmidCursor.lineY.set("visible", false);


// ==========================================
// Population chart
// ==========================================

// Create chart
// https://www.amcharts.com/docs/v5/charts/xy-chart/
var popChart = container.children.push(
  am5xy.XYChart.new(root, {
    width: am5.p50,
    panX: false,
    panY: false,
    wheelX: "none",
    wheelY: "none",
    layout: root.verticalLayout
  })
);

// Add titles
var popSubtitle = popChart.children.unshift(am5.Label.new(root, {
  text: "(hover to see breakdown)",
  x: am5.p50,
  centerX: am5.p50
}));

var popTitle = popChart.children.unshift(am5.Label.new(root, {
  text: "U.S. population",
  fontSize: 20,
  x: am5.p50,
  centerX: am5.p50
}));

// Create axes
// https://www.amcharts.com/docs/v5/charts/xy-chart/axes/
var popXAxis = popChart.xAxes.push(
  am5xy.DateAxis.new(root, {
    maxDeviation: 0.1,
    groupData: false,
    baseInterval: { timeUnit: "year", count: 1 },
    renderer: am5xy.AxisRendererX.new(root, {
      minGridDistance: 40
    }),
    tooltip: am5.Tooltip.new(root, {})
  })
);

var popYAxis = popChart.yAxes.push(
  am5xy.ValueAxis.new(root, {
    maxDeviation: 0.1,
    renderer: am5xy.AxisRendererY.new(root, {
      opposite: true
    })
  })
);

// Add series
// https://www.amcharts.com/docs/v5/charts/xy-chart/series/

var popSeriesMale = popChart.series.push(
  am5xy.LineSeries.new(root, {
    minBulletDistance: 10,
    xAxis: popXAxis,
    yAxis: popYAxis,
    valueYField: "col4",
    valueXField: "col3",
    stacked: true
  })
);

popSeriesMale.strokes.template.setAll({
  strokeWidth: 2,
  templateField: "lineSettings"
});

popSeriesMale.fills.template.setAll({
  visible: true,
  fillOpacity: 0.5,
  templateField: "lineSettings"
});

var popSeriesFemale = popChart.series.push(
  am5xy.LineSeries.new(root, {
    minBulletDistance: 10,
    xAxis: popXAxis,
    yAxis: popYAxis,
    valueYField: "col5",
    valueXField: "col3",
    stacked: true,
    tooltip: am5.Tooltip.new(root, {
      pointerOrientation: "horizontal",
      labelText: "[bold]U.S. population in {valueX.formatDate()}[/]\n[font-size: 20]Male: {col4}\nFemale: {col5}"
    })
  })
);

popSeriesFemale.strokes.template.setAll({
  strokeWidth: 2,
  templateField: "lineSettings"
});

popSeriesFemale.fills.template.setAll({
  visible: true,
  fillOpacity: 0.5,
  templateField: "lineSettings"
});

// Add cursor
// https://www.amcharts.com/docs/v5/charts/xy-chart/cursor/
var popCursor = popChart.set("cursor", am5xy.XYCursor.new(root, {
  xAxis: popXAxis,
  yAxis: popYAxis,
}));
popCursor.lineY.set("visible", false);

popCursor.events.on("cursormoved", function(ev) {
  var x = ev.target.getPrivate("positionX");
  currentYear = popXAxis.positionToDate(x).getFullYear();
  updateData();
});

// Make stuff animate on load
// https://www.amcharts.com/docs/v5/concepts/animations/
popSeriesMale.appear(1000, 100);
popChart.appear(1000, 100);

}); // end am5.ready()
</script>

<!-- HTML -->
<div id="chartdiv"></div>