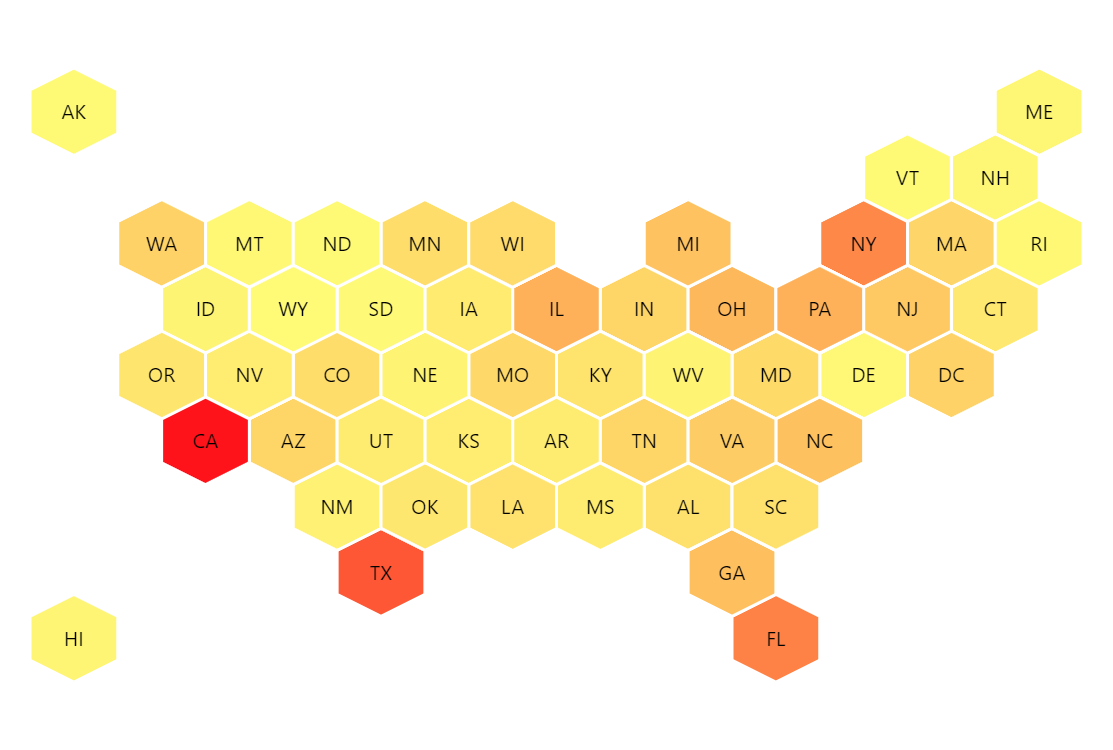
Honeycomb tile map
This Honeycomb or hex map is a simple XYChart with bullets arranged so that they resemble true map.
Related tutorials
Demo source
<!-- Styles -->
<style>
#chartdiv {
  width: 650px;
  height: 500px;
}
</style>

<!-- Resources -->
<script src="https://cdn.amcharts.com/lib/5/index.js"></script>
<script src="https://cdn.amcharts.com/lib/5/xy.js"></script>
<script src="https://cdn.amcharts.com/lib/5/themes/Animated.js"></script>

<!-- Chart code -->
<script>
am5.ready(function() {

/**
 * ---------------------------------------
 * This demo was created using amCharts 5.
 *
 * For more information visit:
 * https://www.amcharts.com/
 *
 * Documentation is available at:
 * https://www.amcharts.com/docs/v5/
 * ---------------------------------------
 */

// Create root element
// https://www.amcharts.com/docs/v5/getting-started/#Root_element
var root = am5.Root.new("chartdiv");

// Set themes
// https://www.amcharts.com/docs/v5/concepts/themes/
root.setThemes([
  am5themes_Animated.new(root)
]);

// Create chart
// https://www.amcharts.com/docs/v5/charts/xy-chart/
var chart = root.container.children.push(am5xy.XYChart.new(root, {}));
// hide grid
chart.gridContainer.set("opacity", 0)


// Create axes
// https://www.amcharts.com/docs/v5/charts/xy-chart/axes/
var xAxis = chart.xAxes.push(am5xy.ValueAxis.new(root, {
  renderer: am5xy.AxisRendererX.new(root, { minGridDistance: 50, inside: true }),
  min: 0,
  max: 12,
  strictMinMax: true,
  opacity: 0
}));

var yAxis = chart.yAxes.push(am5xy.ValueAxis.new(root, {
  renderer: am5xy.AxisRendererY.new(root, { inside: true, inversed: true }),
  min: -1,
  max: 7,
  strictMinMax: true,
  opacity: 0
}));

// Create series
// https://www.amcharts.com/docs/v5/charts/xy-chart/series/
var series = chart.series.push(am5xy.LineSeries.new(root, {
  calculateAggregates: true,
  xAxis: xAxis,
  yAxis: yAxis,
  valueYField: "y",
  valueXField: "x",
  valueField: "value"
}));


// Add bullet
// https://www.amcharts.com/docs/v5/charts/xy-chart/series/#Bullets
var template = am5.Template.new({});
series.bullets.push(function() {
  var graphics = am5.Line.new(root, {
    fill: series.get("fill"),
    tooltipText: "{name} {value}",
    tooltipY: -am5.p50,
    stroke: am5.color(0xffffff),
    strokeWidth: 2
  }, template);


  // we use adapter for x as radius will be called only once and x will be called each time position changes
  graphics.adapters.add("x", function(x, target) {
    var w = Math.abs(xAxis.getX(0, 1, 0) - xAxis.getX(1, 1, 0)) / 2;
    var h = Math.abs(yAxis.getY(0, 1, 0) - yAxis.getY(1, 1, 0)) / 2;

    var p0 = { x: 0, y: -h };
    var p1 = { x: w, y: -h / 2 };
    var p2 = { x: w, y: h / 2 };
    var p3 = { x: 0, y: h };
    var p4 = { x: -w, y: h / 2 };
    var p5 = { x: -w, y: -h / 2 };
    var p6 = { x: 0, y: -h };

    target.set("segments", [[[p0, p1, p2, p3, p4, p5, p6]]])

    // return original x
    return x;
  })

  return am5.Bullet.new(root, {
    sprite: graphics
  });
});

// another bullet for label
series.bullets.push(function() {
  var label = am5.Label.new(root, {
    populateText: true,
    centerX: am5.p50,
    centerY: am5.p50,
    text: "{short}"
  });

  return am5.Bullet.new(root, {
    sprite: label
  });
});

series.set("heatRules", [{
  target: template,
  min: am5.color(0xfffb77),
  max: am5.color(0xfe131a),
  dataField: "value",
  key: "fill"
}]);


series.strokes.template.set("strokeOpacity", 0);


var data = [{
  short: "AL",
  name: "Alabama",
  y: 6,
  x: 7,
  value: 4849300
}, {
  short: "AK",
  name: "Alaska",
  y: 0,
  x: 0,
  value: 737700
}, {
  short: "AZ",
  name: "Arizona",
  y: 5,
  x: 3,
  value: 6745400
}, {
  short: "AR",
  name: "Arkansas",
  y: 5,
  x: 6,
  value: 2994000
}, {
  short: "CA",
  name: "California",
  y: 5,
  x: 2,
  value: 39250000
}, {
  short: "CO",
  name: "Colorado",
  y: 4,
  x: 3,
  value: 5540500
}, {
  short: "CT",
  name: "Connecticut",
  y: 3,
  x: 11,
  value: 3596600
}, {
  short: "DE",
  name: "Delaware",
  y: 4,
  x: 9,
  value: 935600
}, {
  short: "DC",
  name: "District of Columbia",
  y: 4,
  x: 10,
  value: 7288000
}, {
  short: "FL",
  name: "Florida",
  y: 8,
  x: 8,
  value: 20612400
}, {
  short: "GA",
  name: "Georgia",
  y: 7,
  x: 8,
  value: 10310300
}, {
  short: "HI",
  name: "Hawaii",
  y: 8,
  x: 0,
  value: 1419500
}, {
  short: "ID",
  name: "Idaho",
  y: 3,
  x: 2,
  value: 1634400
}, {
  short: "IL",
  name: "Illinois",
  y: 3,
  x: 6,
  value: 12801500
}, {
  short: "IN",
  name: "Indiana",
  y: 3,
  x: 7,
  value: 6596800
}, {
  short: "IA",
  name: "Iowa",
  y: 3,
  x: 5,
  value: 3107100
}, {
  short: "KS",
  name: "Kansas",
  y: 5,
  x: 5,
  value: 2904000
}, {
  short: "KY",
  name: "Kentucky",
  y: 4,
  x: 6,
  value: 4413400
}, {
  short: "LA",
  name: "Louisiana",
  y: 6,
  x: 5,
  value: 4649600
}, {
  short: "ME",
  name: "Maine",
  y: 0,
  x: 11,
  value: 1330000
}, {
  short: "MD",
  name: "Maryland",
  y: 4,
  x: 8,
  value: 6016400
}, {
  short: "MA",
  name: "Massachusetts",
  y: 2,
  x: 10,
  value: 6811700
}, {
  short: "MI",
  name: "Michigan",
  y: 2,
  x: 7,
  value: 9928300
}, {
  short: "MN",
  name: "Minnesota",
  y: 2,
  x: 4,
  value: 5519900
}, {
  short: "MS",
  name: "Mississippi",
  y: 6,
  x: 6,
  value: 2984900
}, {
  short: "MO",
  name: "Missouri",
  y: 4,
  x: 5,
  value: 6093000
}, {
  short: "MT",
  name: "Montana",
  y: 2,
  x: 2,
  value: 1023500
}, {
  short: "NE",
  name: "Nebraska",
  y: 4,
  x: 4,
  value: 1881500
}, {
  short: "NV",
  name: "Nevada",
  y: 4,
  x: 2,
  value: 2839000
}, {
  short: "NH",
  name: "New Hampshire",
  y: 1,
  x: 11,
  value: 1326800
}, {
  short: "NJ",
  name: "New Jersey",
  y: 3,
  x: 10,
  value: 8944400
}, {
  short: "NM",
  name: "New Mexico",
  y: 6,
  x: 3,
  value: 2085500
}, {
  short: "NY",
  name: "New York",
  y: 2,
  x: 9,
  value: 19745200
}, {
  short: "NC",
  name: "North Carolina",
  y: 5,
  x: 9,
  value: 10146700
}, {
  short: "ND",
  name: "North Dakota",
  y: 2,
  x: 3,
  value: 739400
}, {
  short: "OH",
  name: "Ohio",
  y: 3,
  x: 8,
  value: 11614370
}, {
  short: "OK",
  name: "Oklahoma",
  y: 6,
  x: 4,
  value: 3878000
}, {
  short: "OR",
  name: "Oregon",
  y: 4,
  x: 1,
  value: 3970200
}, {
  short: "PA",
  name: "Pennsylvania",
  y: 3,
  x: 9,
  value: 12784200
}, {
  short: "RI",
  name: "Rhode Island",
  y: 2,
  x: 11,
  value: 1055100
}, {
  short: "SC",
  name: "South Carolina",
  y: 6,
  x: 8,
  value: 4832400
}, {
  short: "SD",
  name: "South Dakota",
  y: 3,
  x: 4,
  value: 853100
}, {
  short: "TN",
  name: "Tennessee",
  y: 5,
  x: 7,
  value: 6651100
}, {
  short: "TX",
  name: "Texas",
  y: 7,
  x: 4,
  value: 27862500
}, {
  short: "UT",
  name: "Utah",
  y: 5,
  x: 4,
  value: 2942900
}, {
  short: "VT",
  name: "Vermont",
  y: 1,
  x: 10,
  value: 626010
}, {
  short: "VA",
  name: "Virginia",
  y: 5,
  x: 8,
  value: 8411800
}, {
  short: "WA",
  name: "Washington",
  y: 2,
  x: 1,
  value: 7288000
}, {
  short: "WV",
  name: "West Virginia",
  y: 4,
  x: 7,
  value: 1850320
}, {
  short: "WI",
  name: "Wisconsin",
  y: 2,
  x: 5,
  value: 5778700
}, {
  short: "WY",
  name: "Wyoming",
  y: 3,
  x: 3,
  value: 584150
}]

// loop through all items and add 0,5 to all items in odd rows
var vStep = (1 + am5.math.sin(30)) / 2;
am5.array.each(data, function(di) {
  var dx = 0;
  if (di.y / 2 == Math.round(di.y / 2)) {
    di.x += 0.5;
  }
  // shift y for the hext to stick to each other
  di.y = vStep * di.y;
})

series.data.setAll(data);

// Make stuff animate on load
// https://www.amcharts.com/docs/v5/concepts/animations/
series.appear(1000);

chart.appear(1000, 100);


}); // end am5.ready()
</script>

<!-- HTML -->
<div id="chartdiv"></div>