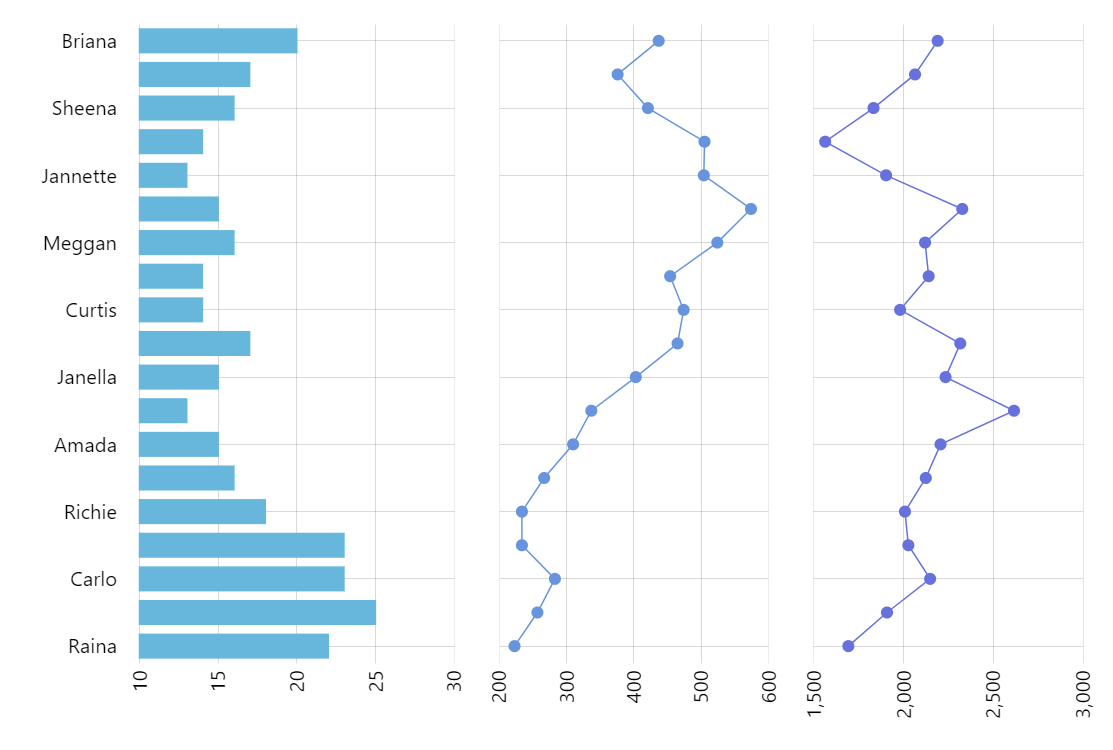
Horizontally Stacked Axes
Similarly to vertically stacked axes you can stack them horizontally. It’s a single XY chart with one shared Y axis and multiple value axes. Instead of arranging them one under another we arrange them horizontally. You can specify custom width for each of the axes if you don’t want them to be of the same width.
For more gritty details about stacked, examples, and code visit this tutorial.
Related tutorials
Demo source
<!-- Styles -->
<style>
#chartdiv {
  width: 100%;
  height: 600px;
}
</style>

<!-- Resources -->
<script src="https://cdn.amcharts.com/lib/5/index.js"></script>
<script src="https://cdn.amcharts.com/lib/5/xy.js"></script>
<script src="https://cdn.amcharts.com/lib/5/themes/Animated.js"></script>

<!-- Chart code -->
<script>
am5.ready(function() {

var data = [];
var value1 = 20;
var value2 = 200;
var value3 = 2000;

var names = [
  "Raina",
  "Demarcus",
  "Carlo",
  "Jacinda",
  "Richie",
  "Antony",
  "Amada",
  "Idalia",
  "Janella",
  "Marla",
  "Curtis",
  "Shellie",
  "Meggan",
  "Nathanael",
  "Jannette",
  "Tyrell",
  "Sheena",
  "Maranda",
  "Briana"
];

for (var i = 0; i < names.length; i++) {
  value1 += Math.round(
    (Math.random() < 0.5 ? 1 : -1) * Math.random() * value1 * 0.2
  );
  value2 += Math.round(
    (Math.random() < 0.5 ? 1 : -1) * Math.random() * value2 * 0.2
  );
  value3 += Math.round(
    (Math.random() < 0.5 ? 1 : -1) * Math.random() * value3 * 0.2
  );
  data.push({
    category: names[i],
    value1: value1,
    value2: value2,
    value3: value3
  });
}

// Create root element
// https://www.amcharts.com/docs/v5/getting-started/#Root_element
var root = am5.Root.new("chartdiv");

// Set themes
// https://www.amcharts.com/docs/v5/concepts/themes/
root.setThemes([
  am5themes_Animated.new(root)
]);

// Create chart
// https://www.amcharts.com/docs/v5/charts/xy-chart/
var chart = root.container.children.push(
  am5xy.XYChart.new(root, {
    panX: false,
    panY: true,
    wheelX: "none",
    wheelY: "zoomY",
    arrangeTooltips: false,
  pinchZoomY:true
  })
);

// make x axes stack
chart.bottomAxesContainer.set("layout", root.horizontalLayout);

// Create axes
// https://www.amcharts.com/docs/v5/charts/xy-chart/axes/
var yRenderer = am5xy.AxisRendererY.new(root, {
  minGridDistance: 25
});

yRenderer.labels.template.setAll({
  multiLocation: 0.5,
  location: 0.5,
  paddingRight: 15
});

yRenderer.grid.template.set("location", 0.5);

var yAxis = chart.yAxes.push(
  am5xy.CategoryAxis.new(root, {
    categoryField: "category",
    tooltip: am5.Tooltip.new(root, {}),
    renderer: yRenderer
  })
);

yAxis.data.setAll(data);

// Add series
// https://www.amcharts.com/docs/v5/charts/xy-chart/series/
function createSeries(field, margin, column) {
  var xRenderer = am5xy.AxisRendererX.new(root, {
    minGridDistance: 40
  });

  xRenderer.labels.template.setAll({
    rotation: -90,
    centerY: am5.p50
  });

  var xAxis = chart.xAxes.push(
    am5xy.ValueAxis.new(root, {
      renderer: xRenderer,
      tooltip: am5.Tooltip.new(root, {
        animationDuration: 0
      }),
      marginLeft: margin // this makes gap between axes
    })
  );

  var series;
  if (column) {
    series = chart.series.push(
      am5xy.ColumnSeries.new(root, {
        xAxis: xAxis,
        yAxis: yAxis,
        valueXField: field,
        categoryYField: "category",
        sequencedInterpolation: true,
        tooltip: am5.Tooltip.new(root, {
          pointerOrientation: "horizontal",
          labelText: "{valueX}"
        })
      })
    );
  } else {
    series = chart.series.push(
      am5xy.LineSeries.new(root, {
        xAxis: xAxis,
        yAxis: yAxis,
        valueXField: field,
        categoryYField: "category",
        sequencedInterpolation: true,
        tooltip: am5.Tooltip.new(root, {
          pointerOrientation: "horizontal",
          labelText: "{valueX}"
        })
      })
    );
  }

  if (!column) {
    series.bullets.push(function () {
      return am5.Bullet.new(root, {
        locationX: 1,
        locationY: 0.5,
        sprite: am5.Circle.new(root, {
          radius: 4,
          fill: series.get("fill")
        })
      });
    });
  }

  series.data.setAll(data);
  series.appear();

  return series;
}

createSeries("value1", 0, true);
createSeries("value2", 30, false);
createSeries("value3", 30, false);

// Add cursor
// https://www.amcharts.com/docs/v5/charts/xy-chart/cursor/
var cursor = chart.set("cursor", am5xy.XYCursor.new(root, {
  behavior: "none",
  yAxis: yAxis
}));

// Make stuff animate on load
// https://www.amcharts.com/docs/v5/concepts/animations/
chart.appear(1000, 100);

}); // end am5.ready()
</script>

<!-- HTML -->
<div id="chartdiv"></div>