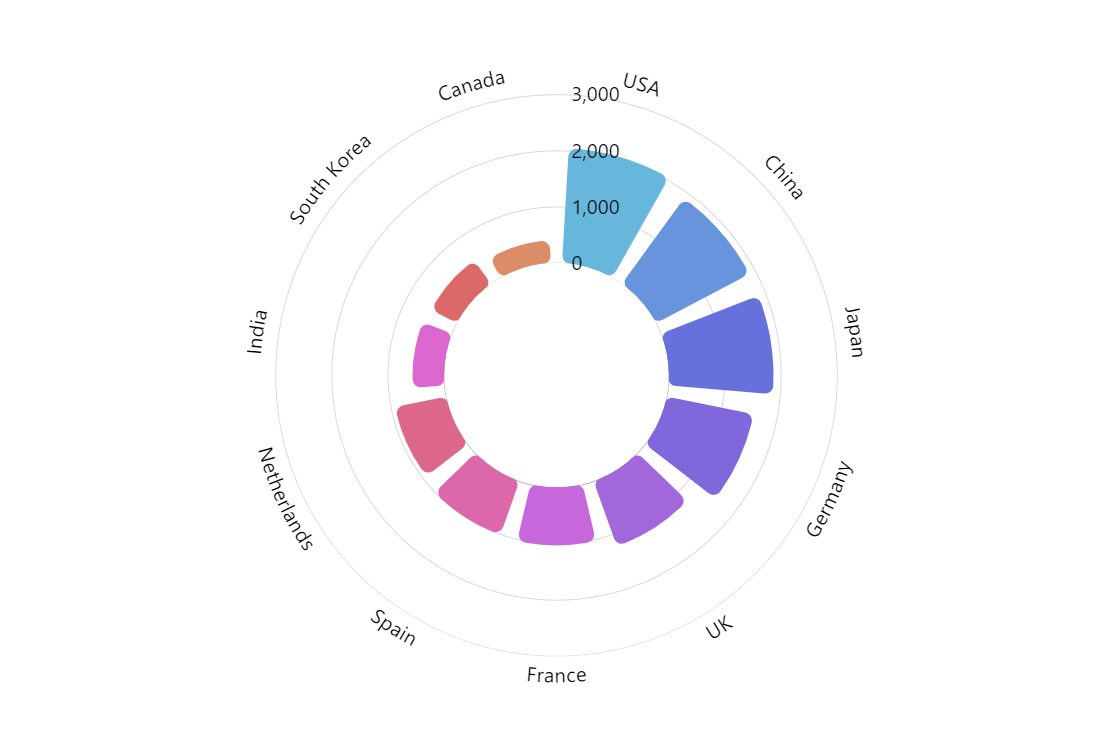
Live Sorting of Radar Columns
This demo showcases a radar chart with real-time data and columns sorted by value.
Key implementation details
When the values change we sort the data by value. Then we need to rearrange our category axis (countries) accordingly. We find corresponding indices between the newly sorted data and previous category position on the axis and change and animate the axis positions accordingly. See the comments in the demo code for the exact details on how to implement this.
Related tutorials
Demo source
<!-- Styles -->
<style>
#chartdiv {
  width: 100%;
  height: 600px;
}
</style>

<!-- Resources -->
<script src="https://cdn.amcharts.com/lib/5/index.js"></script>
<script src="https://cdn.amcharts.com/lib/5/xy.js"></script>
<script src="https://cdn.amcharts.com/lib/5/radar.js"></script>
<script src="https://cdn.amcharts.com/lib/5/themes/Animated.js"></script>

<!-- Chart code -->
<script>
am5.ready(function() {

// Create root element
// https://www.amcharts.com/docs/v5/getting-started/#Root_element
var root = am5.Root.new("chartdiv");


// Set themes
// https://www.amcharts.com/docs/v5/concepts/themes/
root.setThemes([
  am5themes_Animated.new(root)
]);


// Create chart
// https://www.amcharts.com/docs/v5/charts/xy-chart/
var chart = root.container.children.push(am5radar.RadarChart.new(root, {
  panX: true,
  panY: true,
  wheelX: "none",
  wheelY: "none",
  innerRadius:am5.percent(40)
}));

// We don't want zoom-out button to appear while animating, so we hide it
chart.zoomOutButton.set("forceHidden", true);


// Create axes
// https://www.amcharts.com/docs/v5/charts/xy-chart/axes/
var xRenderer = am5radar.AxisRendererCircular.new(root, {
  minGridDistance: 30
});

xRenderer.grid.template.set("visible", false);

var xAxis = chart.xAxes.push(am5xy.CategoryAxis.new(root, {
  maxDeviation: 0.3,
  categoryField: "country",
  renderer: xRenderer
}));

var yAxis = chart.yAxes.push(am5xy.ValueAxis.new(root, {
  maxDeviation: 0.3,
  min: 0,
  renderer: am5radar.AxisRendererRadial.new(root, {})
}));


// Add series
// https://www.amcharts.com/docs/v5/charts/xy-chart/series/
var series = chart.series.push(am5radar.RadarColumnSeries.new(root, {
  name: "Series 1",
  xAxis: xAxis,
  yAxis: yAxis,
  valueYField: "value",
  categoryXField: "country"
}));

// Rounded corners for columns
series.columns.template.setAll({
  cornerRadius: 5,
  tooltipText:"{categoryX}: {valueY}"
});

// Make each column to be of a different color
series.columns.template.adapters.add("fill", function (fill, target) {
  return chart.get("colors").getIndex(series.columns.indexOf(target ));
});

series.columns.template.adapters.add("stroke", function (stroke, target) {
  return chart.get("colors").getIndex(series.columns.indexOf(target ));
});

// Set data
var data = [{
  "country": "USA",
  "value": 2025
}, {
  "country": "China",
  "value": 1882
}, {
  "country": "Japan",
  "value": 1809
}, {
  "country": "Germany",
  "value": 1322
}, {
  "country": "UK",
  "value": 1122
}, {
  "country": "France",
  "value": 1114
}, {
  "country": "India",
  "value": 984
}, {
  "country": "Spain",
  "value": 711
}, {
  "country": "Netherlands",
  "value": 665
}, {
  "country": "South Korea",
  "value": 443
}, {
  "country": "Canada",
  "value": 441
}];

xAxis.data.setAll(data);
series.data.setAll(data);

// update data with random values each 1.5 sec
setInterval(function () {
  updateData();
}, 1500)

function updateData() {
  am5.array.each(series.dataItems, function (dataItem) {
    var value = dataItem.get("valueY") + Math.round(Math.random() * 400 - 200);
    if (value < 0) {
      value = 10;
    }
    // both valueY and workingValueY should be changed, we only animate workingValueY
    dataItem.set("valueY", value);
    dataItem.animate({
      key: "valueYWorking",
      to: value,
      duration: 600,
      easing: am5.ease.out(am5.ease.cubic)
    });
  })

  sortCategoryAxis();
}


// Get series item by category
function getSeriesItem(category) {
  for (var i = 0; i < series.dataItems.length; i++) {
    var dataItem = series.dataItems[i];
    if (dataItem.get("categoryX") == category) {
      return dataItem;
    }
  }
}


// Axis sorting
function sortCategoryAxis() {

  // Sort by value
  series.dataItems.sort(function (x, y) {
    return y.get("valueY") - x.get("valueY"); // descending
    //return y.get("valueY") - x.get("valueY"); // ascending
  })

  // Go through each axis item
  am5.array.each(xAxis.dataItems, function (dataItem) {
    // get corresponding series item
    var seriesDataItem = getSeriesItem(dataItem.get("category"));

    if (seriesDataItem) {
      // get index of series data item
      var index = series.dataItems.indexOf(seriesDataItem);
      // calculate delta position
      var deltaPosition = (index - dataItem.get("index", 0)) / series.dataItems.length;
      // set index to be the same as series data item index
      dataItem.set("index", index);
      // set deltaPosition instanlty
      dataItem.set("deltaPosition", -deltaPosition);
      // animate delta position to 0
      dataItem.animate({
        key: "deltaPosition",
        to: 0,
        duration: 1000,
        easing: am5.ease.out(am5.ease.cubic)
      })
    }
  });

  // Sort axis items by index.
  // This changes the order instantly, but as deltaPosition is set,
  // they keep in the same places and then animate to true positions.
  xAxis.dataItems.sort(function (x, y) {
    return x.get("index") - y.get("index");
  });
}


// Make stuff animate on load
// https://www.amcharts.com/docs/v5/concepts/animations/
series.appear(1000);
chart.appear(1000, 100);

}); // end am5.ready()
</script>

<!-- HTML -->
<div id="chartdiv"></div>