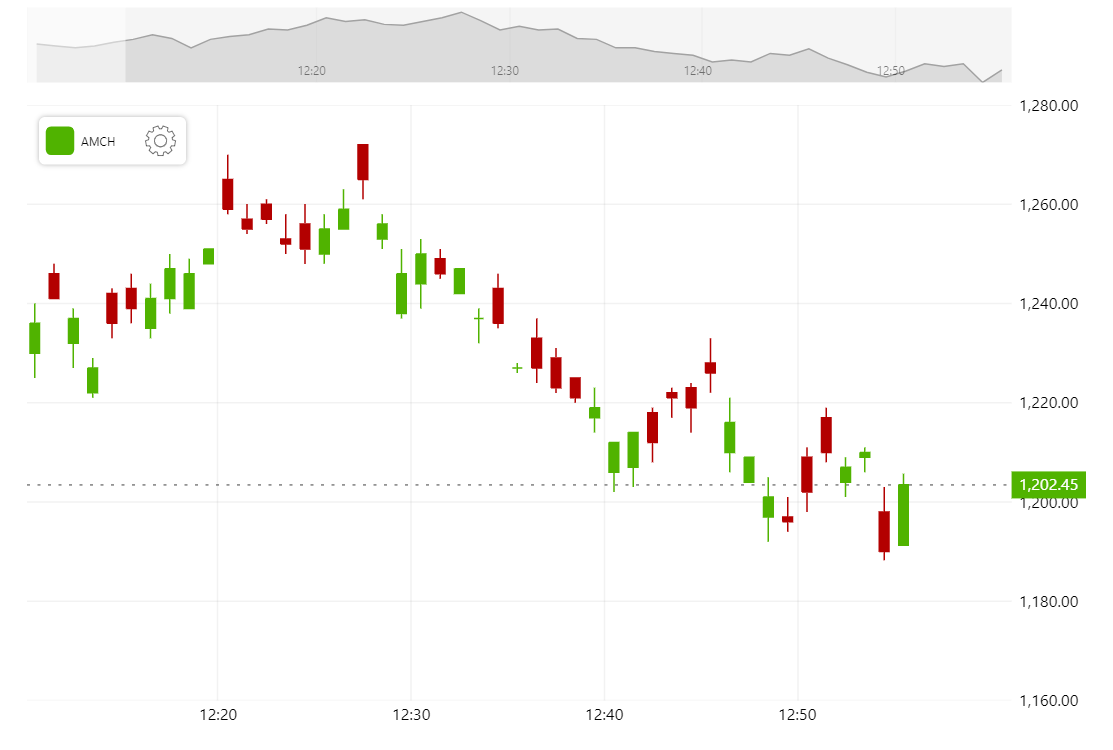
Live Stock Data
Stock Chart can display static data from a historical dataset. It can display live constantly updated data just as well. This demo shows how to setup a cursor to follow the latest data, update the dataset in real time, animate the data label to its new location and adjust the color based on the value.
Related tutorials
Demo source
<!-- Styles -->
<style>
#chartdiv {
  width: 100%;
  height: 600px;
  max-width: 100%
}
</style>

<!-- Resources -->
<script src="https://cdn.amcharts.com/lib/5/index.js"></script>
<script src="https://cdn.amcharts.com/lib/5/xy.js"></script>
<script src="https://cdn.amcharts.com/lib/5/stock.js"></script>
<script src="https://cdn.amcharts.com/lib/5/themes/Animated.js"></script>

<!-- Chart code -->
<script>
am5.ready(function() {

// Create root element
// -------------------------------------------------------------------------------
// https://www.amcharts.com/docs/v5/getting-started/#Root_element
var root = am5.Root.new("chartdiv");

const myTheme = am5.Theme.new(root);

myTheme.rule("Grid", ["scrollbar", "minor"]).setAll({
  visible:false
});

root.setThemes([
  am5themes_Animated.new(root),
  myTheme
]);

// Create a stock chart
// -------------------------------------------------------------------------------
// https://www.amcharts.com/docs/v5/charts/stock/#Instantiating_the_chart
var stockChart = root.container.children.push(
  am5stock.StockChart.new(root, {
    paddingRight: 0
  })
);

// Set global number format
// -------------------------------------------------------------------------------
// https://www.amcharts.com/docs/v5/concepts/formatters/formatting-numbers/
root.numberFormatter.set("numberFormat", "#,###.00");

// Create a main stock panel (chart)
// -------------------------------------------------------------------------------
// https://www.amcharts.com/docs/v5/charts/stock/#Adding_panels
var mainPanel = stockChart.panels.push(
  am5stock.StockPanel.new(root, {
    wheelY: "zoomX",
    panX: true,
    panY: true
  })
);

// Create value axis
// -------------------------------------------------------------------------------
// https://www.amcharts.com/docs/v5/charts/xy-chart/axes/
var valueAxis = mainPanel.yAxes.push(
  am5xy.ValueAxis.new(root, {
    renderer: am5xy.AxisRendererY.new(root, {
      pan: "zoom"
    }),
    extraMin: 0.1, // adds some space for for main series
    tooltip: am5.Tooltip.new(root, {}),
    numberFormat: "#,###.00",
    extraTooltipPrecision: 2
  })
);

var dateAxis = mainPanel.xAxes.push(
  am5xy.GaplessDateAxis.new(root, {
    extraMax:0.1,
    baseInterval: {
      timeUnit: "minute",
      count: 1
    },
    renderer: am5xy.AxisRendererX.new(root, {
      pan: "zoom",
      minorGridEnabled: true
    }),
    tooltip: am5.Tooltip.new(root, {})
  })
);

// add range which will show current value
var currentValueDataItem = valueAxis.createAxisRange(valueAxis.makeDataItem({ value: 0 }));
var currentLabel = currentValueDataItem.get("label");
if (currentLabel) {
  currentLabel.setAll({
    fill: am5.color(0xffffff),
    background: am5.Rectangle.new(root, { fill: am5.color(0x000000) })
  })
}

var currentGrid = currentValueDataItem.get("grid");
if (currentGrid) {
  currentGrid.setAll({ strokeOpacity: 0.5, strokeDasharray: [2, 5] });
}


// Add series
// -------------------------------------------------------------------------------
// https://www.amcharts.com/docs/v5/charts/xy-chart/series/
var valueSeries = mainPanel.series.push(
  am5xy.CandlestickSeries.new(root, {
    name: "AMCH",
    clustered: false,
    valueXField: "Date",
    valueYField: "Close",
    highValueYField: "High",
    lowValueYField: "Low",
    openValueYField: "Open",
    calculateAggregates: true,
    xAxis: dateAxis,
    yAxis: valueAxis,
    legendValueText:
      "open: [bold]{openValueY}[/] high: [bold]{highValueY}[/] low: [bold]{lowValueY}[/] close: [bold]{valueY}[/]",
    legendRangeValueText: ""
  })
);

// Set main value series
// -------------------------------------------------------------------------------
// https://www.amcharts.com/docs/v5/charts/stock/#Setting_main_series
stockChart.set("stockSeries", valueSeries);

// Add a stock legend
// -------------------------------------------------------------------------------
// https://www.amcharts.com/docs/v5/charts/stock/stock-legend/
var valueLegend = mainPanel.plotContainer.children.push(
  am5stock.StockLegend.new(root, {
    stockChart: stockChart
  })
);

// Set main series
// -------------------------------------------------------------------------------
// https://www.amcharts.com/docs/v5/charts/stock/#Setting_main_series
valueLegend.data.setAll([valueSeries]);

// Add cursor(s)
// -------------------------------------------------------------------------------
// https://www.amcharts.com/docs/v5/charts/xy-chart/cursor/
mainPanel.set(
  "cursor",
  am5xy.XYCursor.new(root, {
    yAxis: valueAxis,
    xAxis: dateAxis,
    snapToSeries: [valueSeries],
    snapToSeriesBy: "y!"
  })
);

// Add scrollbar
// -------------------------------------------------------------------------------
// https://www.amcharts.com/docs/v5/charts/xy-chart/scrollbars/
var scrollbar = mainPanel.set(
  "scrollbarX",
  am5xy.XYChartScrollbar.new(root, {
    orientation: "horizontal",
    height: 50
  })
);
stockChart.toolsContainer.children.push(scrollbar);

var sbDateAxis = scrollbar.chart.xAxes.push(
  am5xy.GaplessDateAxis.new(root, {
    extraMax:0.1,
    baseInterval: {
      timeUnit: "minute",
      count: 1
    },
    renderer: am5xy.AxisRendererX.new(root, {
      minorGridEnabled: true
    })
  })
);

var sbValueAxis = scrollbar.chart.yAxes.push(
  am5xy.ValueAxis.new(root, {
    renderer: am5xy.AxisRendererY.new(root, {})
  })
);

var sbSeries = scrollbar.chart.series.push(
  am5xy.LineSeries.new(root, {
    valueYField: "Close",
    valueXField: "Date",
    xAxis: sbDateAxis,
    yAxis: sbValueAxis
  })
);

sbSeries.fills.template.setAll({
  visible: true,
  fillOpacity: 0.3
});

// Data generator
var firstDate = new Date();
var lastDate;
var value = 1200;

// data
function generateChartData() {
  var chartData = [];

  for (var i = 0; i < 50; i++) {
    var newDate = new Date(firstDate);
    newDate.setMinutes(newDate.getMinutes() - i);

    value += Math.round((Math.random() < 0.49 ? 1 : -1) * Math.random() * 10);

    var open = value + Math.round(Math.random() * 16 - 8);
    var low = Math.min(value, open) - Math.round(Math.random() * 5);
    var high = Math.max(value, open) + Math.round(Math.random() * 5);

    chartData.unshift({
      Date: newDate.getTime(),
      Close: value,
      Open: open,
      Low: low,
      High: high
    });

    lastDate = newDate;
  }
  return chartData;
}

var data = generateChartData();

// set data to all series
valueSeries.data.setAll(data);
sbSeries.data.setAll(data);

// update data
var previousDate;

setInterval(function () {
  var valueSeries = stockChart.get("stockSeries");
  var date = Date.now();
  var lastDataObject = valueSeries.data.getIndex(valueSeries.data.length - 1);
  if (lastDataObject) {
    var previousDate = lastDataObject.Date;
    var previousValue = lastDataObject.Close;

    value = am5.math.round(previousValue + (Math.random() < 0.5 ? 1 : -1) * Math.random() * 2, 2);

    var high = lastDataObject.High;
    var low = lastDataObject.Low;
    var open = lastDataObject.Open;

    if (am5.time.checkChange(date, previousDate, "minute")) {
      open = value;
      high = value;
      low = value;

      var dObj1 = {
        Date: date,
        Close: value,
        Open: value,
        Low: value,
        High: value
      };

      valueSeries.data.push(dObj1);
      sbSeries.data.push(dObj1);
      previousDate = date;
    } else {
      if (value > high) {
        high = value;
      }

      if (value < low) {
        low = value;
      }

      var dObj2 = {
        Date: date,
        Close: value,
        Open: open,
        Low: low,
        High: high
      };

      valueSeries.data.setIndex(valueSeries.data.length - 1, dObj2);
      sbSeries.data.setIndex(sbSeries.data.length - 1, dObj2);
    }
    // update current value
    if (currentLabel) {
      currentValueDataItem.animate({ key: "value", to: value, duration: 500, easing: am5.ease.out(am5.ease.cubic) });
      currentLabel.set("text", stockChart.getNumberFormatter().format(value));
      var bg = currentLabel.get("background");
      if (bg) {
        if (value < open) {
          bg.set("fill", root.interfaceColors.get("negative"));
        }
        else {
          bg.set("fill", root.interfaceColors.get("positive"));
        }
      }
    }
  }
}, 1000);

}); // end am5.ready()
</script>

<!-- HTML -->
<div id="chartdiv"></div>