Location-Sensitive Map
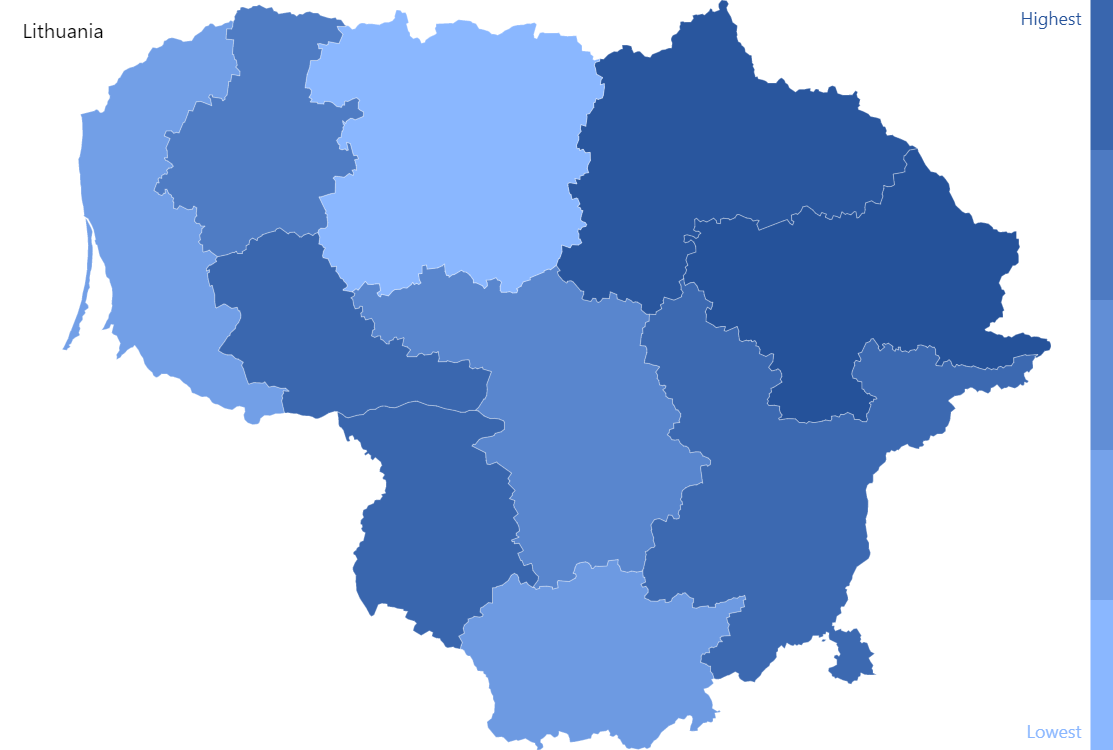
This is a demo of dynamically loading a local map based on the viewer’s location.
Key implementation details
In this demo we determine the viewer’s country by their IP address and then dynamically load a map for that country using the net.load helper utility.
Related tutorials
Demo source
<!-- Styles -->
<style>
#chartdiv {
  width: 100%;
  height: 500px
}
</style>

<!-- Resources -->
<script src="https://cdn.amcharts.com/lib/5/index.js"></script>
<script src="https://cdn.amcharts.com/lib/5/map.js"></script>
<script src="https://cdn.amcharts.com/lib/5/themes/Animated.js"></script>
<script src="https://cdn.amcharts.com/lib/5/geodata/data/countries2.js"></script>

<!-- Chart code -->
<script>
am5.ready(function() {

// Create root element
// https://www.amcharts.com/docs/v5/getting-started/#Root_element
var root = am5.Root.new("chartdiv");

// Set themes
// https://www.amcharts.com/docs/v5/concepts/themes/
root.setThemes([
  am5themes_Animated.new(root)
]);

// Create the map chart
// https://www.amcharts.com/docs/v5/charts/map-chart/
var chart = root.container.children.push(am5map.MapChart.new(root, {
  panX: "rotateX",
  projection: am5map.geoMercator(),
  layout: root.horizontalLayout
}));

am5.net.load("https://www.amcharts.com/tools/country/?v=xz6Z", chart).then(function (result) {
   var geo = am5.JSONParser.parse(result.response);
   loadGeodata(geo.country_code);
});

// Create polygon series for continents
// https://www.amcharts.com/docs/v5/charts/map-chart/map-polygon-series/
var polygonSeries = chart.series.push(am5map.MapPolygonSeries.new(root, {
  calculateAggregates: true,
  valueField: "value"
}));

polygonSeries.mapPolygons.template.setAll({
  tooltipText: "{name}",
  interactive: true
});

polygonSeries.mapPolygons.template.states.create("hover", {
  fill: am5.color(0x677935)
});

polygonSeries.set("heatRules", [{
  target: polygonSeries.mapPolygons.template,
  dataField: "value",
  min: am5.color(0x8ab7ff),
  max: am5.color(0x25529a),
  key: "fill"
}]);

polygonSeries.mapPolygons.template.events.on("pointerover", function(ev) {
  heatLegend.showValue(ev.target.dataItem.get("value"));
});

function loadGeodata(country) {

  // Default map
  var defaultMap = "usaLow";

  if (country == "US") {
    chart.set("projection", am5map.geoAlbersUsa());
  }
  else {
    chart.set("projection", am5map.geoMercator());
  }

  // calculate which map to be used
  var currentMap = defaultMap;
  var title = "";
  if (am5geodata_data_countries2[country] !== undefined) {
    currentMap = am5geodata_data_countries2[country]["maps"][0];

    // add country title
    if (am5geodata_data_countries2[country]["country"]) {
      title = am5geodata_data_countries2[country]["country"];
    }
  }

  am5.net.load("https://cdn.amcharts.com/lib/5/geodata/json/" + currentMap + ".json", chart).then(function (result) {
    var geodata = am5.JSONParser.parse(result.response);
    var data = [];
    for(var i = 0; i < geodata.features.length; i++) {
      data.push({
        id: geodata.features[i].id,
        value: Math.round( Math.random() * 10000 )
      });
    }

    polygonSeries.set("geoJSON", geodata);
    polygonSeries.data.setAll(data)
  });

  chart.seriesContainer.children.push(am5.Label.new(root, {
    x: 5,
    y: 5,
    text: title,
    background: am5.RoundedRectangle.new(root, {
      fill: am5.color(0xffffff),
      fillOpacity: 0.2
    })
  }))

}

var heatLegend = chart.children.push(
  am5.HeatLegend.new(root, {
    orientation: "vertical",
    startColor: am5.color(0x8ab7ff),
    endColor: am5.color(0x25529a),
    startText: "Lowest",
    endText: "Highest",
    stepCount: 5
  })
);

heatLegend.startLabel.setAll({
  fontSize: 12,
  fill: heatLegend.get("startColor")
});

heatLegend.endLabel.setAll({
  fontSize: 12,
  fill: heatLegend.get("endColor")
});

// change this to template when possible
polygonSeries.events.on("datavalidated", function () {
  heatLegend.set("startValue", polygonSeries.getPrivate("valueLow"));
  heatLegend.set("endValue", polygonSeries.getPrivate("valueHigh"));
});

}); // end am5.ready()
</script>

<!-- HTML -->
<div id="chartdiv"></div>