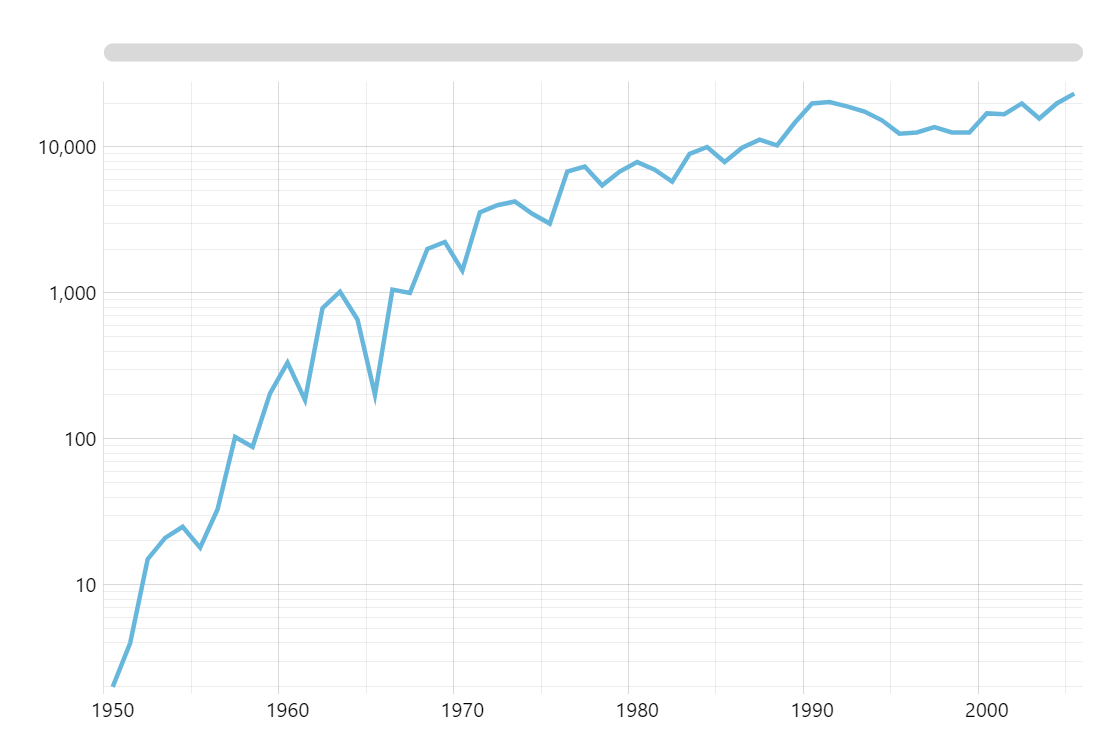
Logarithmic Scale
Displaying wide-ranging values on a regular (linear) scale makes charts unreadable. Switch your value axis to logarithmic scale and get back to highly useful data visualizations.
Key implementation details
All it takes is setting logarithmic: true on your ValueAxis.
Related tutorials
Demo source
<!-- Styles -->
<style>
#chartdiv {
  width: 100%;
  height: 500px;
}
</style>

<!-- Resources -->
<script src="https://cdn.amcharts.com/lib/5/index.js"></script>
<script src="https://cdn.amcharts.com/lib/5/xy.js"></script>
<script src="https://cdn.amcharts.com/lib/5/themes/Animated.js"></script>

<!-- Chart code -->
<script>
am5.ready(function() {

// Create root element
// https://www.amcharts.com/docs/v5/getting-started/#Root_element
var root = am5.Root.new("chartdiv");

root.dateFormatter.setAll({
  dateFormat: "yyyy",
  dateFields: ["valueX"]
});


// Set themes
// https://www.amcharts.com/docs/v5/concepts/themes/
root.setThemes([
  am5themes_Animated.new(root)
]);


// Create chart
// https://www.amcharts.com/docs/v5/charts/xy-chart/
var chart = root.container.children.push(am5xy.XYChart.new(root, {
  panX: true,
  panY: true,
  wheelX: "panX",
  wheelY: "zoomX",
  pinchZoomX: true
}));


// Add cursor
// https://www.amcharts.com/docs/v5/charts/xy-chart/cursor/
var cursor = chart.set("cursor", am5xy.XYCursor.new(root, {
  behavior: "none"
}));
cursor.lineY.set("visible", false);


// Data
var data = [
  { year: "1950", value: 2 },
  { year: "1951", value: 4 },
  { year: "1952", value: 15 },
  { year: "1953", value: 21 },
  { year: "1954", value: 25 },
  { year: "1955", value: 18 },
  { year: "1956", value: 33 },
  { year: "1957", value: 103 },
  { year: "1958", value: 88 },
  { year: "1959", value: 205 },
  { year: "1960", value: 333 },
  { year: "1961", value: 185 },
  { year: "1962", value: 788 },
  { year: "1963", value: 1020 },
  { year: "1964", value: 658 },
  { year: "1965", value: 201 },
  { year: "1966", value: 1054 },
  { year: "1967", value: 999 },
  { year: "1968", value: 2002 },
  { year: "1969", value: 2235 },
  { year: "1970", value: 1423 },
  { year: "1971", value: 3564 },
  { year: "1972", value: 3987 },
  { year: "1973", value: 4235 },
  { year: "1974", value: 3487 },
  { year: "1975", value: 2987 },
  { year: "1976", value: 6789 },
  { year: "1977", value: 7354 },
  { year: "1978", value: 5457 },
  { year: "1979", value: 6784 },
  { year: "1980", value: 7878 },
  { year: "1981", value: 6987 },
  { year: "1982", value: 5787 },
  { year: "1983", value: 8978 },
  { year: "1984", value: 10003 },
  { year: "1985", value: 7898 },
  { year: "1986", value: 9878 },
  { year: "1987", value: 11235 },
  { year: "1988", value: 10248 },
  { year: "1989", value: 14589 },
  { year: "1990", value: 19878 },
  { year: "1991", value: 20325 },
  { year: "1992", value: 18978 },
  { year: "1993", value: 17485 },
  { year: "1994", value: 15234 },
  { year: "1995", value: 12345 },
  { year: "1996", value: 12584 },
  { year: "1997", value: 13698 },
  { year: "1998", value: 12568 },
  { year: "1999", value: 12587 },
  { year: "2000", value: 16987 },
  { year: "2001", value: 16779 },
  { year: "2002", value: 19878 },
  { year: "2003", value: 15687 },
  { year: "2004", value: 19878 },
  { year: "2005", value: 23212 }
];

// Create axes
// https://www.amcharts.com/docs/v5/charts/xy-chart/axes/
var xAxis = chart.xAxes.push(am5xy.DateAxis.new(root, {
  baseInterval: { timeUnit: "year", count: 1 },
  renderer: am5xy.AxisRendererX.new(root, {
    minorGridEnabled: true,
    minGridDistance: 70
  }),
  tooltip: am5.Tooltip.new(root, {})
}));

var yAxis = chart.yAxes.push(am5xy.ValueAxis.new(root, {
  logarithmic: true,
  renderer: am5xy.AxisRendererY.new(root, {
    minorGridEnabled: true
  })
}));

// Add series
// https://www.amcharts.com/docs/v5/charts/xy-chart/series/
var series = chart.series.push(am5xy.LineSeries.new(root, {
  xAxis: xAxis,
  yAxis: yAxis,
  valueYField: "value",
  valueXField: "year",
  tooltip: am5.Tooltip.new(root, {
    labelText: "{valueX}: {valueY}"
  })
}));

series.strokes.template.setAll({
  strokeWidth: 3
});

// Set up data processor to parse string dates
// https://www.amcharts.com/docs/v5/concepts/data/#Pre_processing_data
series.data.processor = am5.DataProcessor.new(root, {
  dateFormat: "yyyy",
  dateFields: ["year"]
});

series.data.setAll(data);


// Add scrollbar
// https://www.amcharts.com/docs/v5/charts/xy-chart/scrollbars/
chart.set("scrollbarX", am5.Scrollbar.new(root, {
  orientation: "horizontal"
}));


// Make stuff animate on load
// https://www.amcharts.com/docs/v5/concepts/animations/
series.appear(1000);
chart.appear(1000, 100);

}); // end am5.ready()
</script>

<!-- HTML -->
<div id="chartdiv"></div>